Difference between revisions of "Climate change"
ChristineLN (talk | contribs) |
ChristineLN (talk | contribs) |
||
| (90 intermediate revisions by 2 users not shown) | |||
| Line 1: | Line 1: | ||
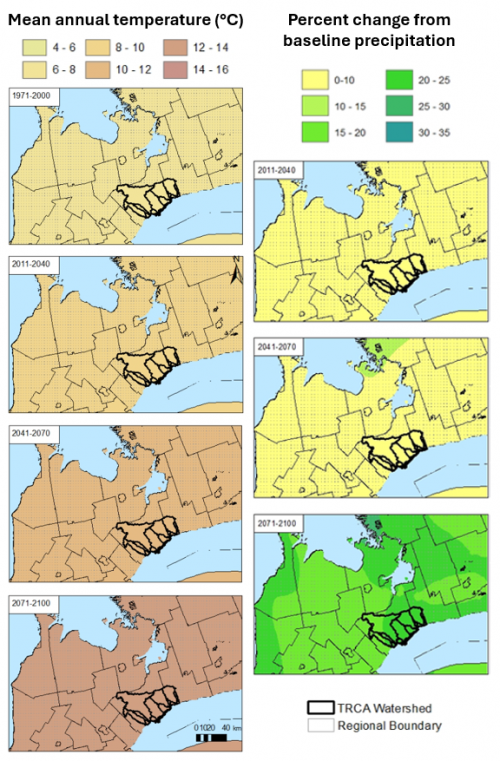
| − | [[File:Screenshot 2025-08-27 151300.png| | + | [[File:Screenshot 2025-08-27 151300.png|500px|thumb|right|link=https://storymaps.arcgis.com/collections/8c517b063c81449d8fba71ca02d4278f?item=6|Maps showing predicted increases in temperature and precipitation for Toronto Region over the 21st Century under the high GHG emission scenario. Adapted from TRCA (2025)<ref>TRCA. 2025. Watershed and Ecosystems Reporting Hub. https://storymaps.arcgis.com/collections/8c517b063c81449d8fba71ca02d4278f?item=6</ref>. Click on the image to go to TRCA's Watershed and Ecosystems Reporting Hub and explore future climate trends.]] |
| + | {{TOClimit|3}} | ||
==Overview== | ==Overview== | ||
Climate change refers to long-term alterations in temperature, precipitation, wind patterns, and other aspects of the Earth’s climate system, largely driven by human activities. The dominant cause is the increased concentration of greenhouse gases, primarily from fossil fuel combustion, industrial processes, and land-use change (IPCC, 2021)<ref>IPCC. 2021. Climate Change 2021: The Physical Science Basis. Contribution of Working Group I to the Sixth Assessment Report of the Intergovernmental Panel on Climate Change. Cambridge University Press</ref>. | Climate change refers to long-term alterations in temperature, precipitation, wind patterns, and other aspects of the Earth’s climate system, largely driven by human activities. The dominant cause is the increased concentration of greenhouse gases, primarily from fossil fuel combustion, industrial processes, and land-use change (IPCC, 2021)<ref>IPCC. 2021. Climate Change 2021: The Physical Science Basis. Contribution of Working Group I to the Sixth Assessment Report of the Intergovernmental Panel on Climate Change. Cambridge University Press</ref>. | ||
| Line 7: | Line 8: | ||
*Increased temperature worsens heatwaves, which are compounded with the urban heat island effect and increased drought length and intensity (Foster et al., 2011)<ref name=Foster></ref> | *Increased temperature worsens heatwaves, which are compounded with the urban heat island effect and increased drought length and intensity (Foster et al., 2011)<ref name=Foster></ref> | ||
*Disrupts [[Groundwater|groundwater]] recharge by altering the amount of soil [[Infiltration|infiltration]] (Wu et al., 2020)<ref>Wu, WY., Lo, MH., Wada, Y. 2020. Divergent effects of climate change on future groundwater availability in key mid-latitude aquifers. https://doi.org/10.1038/s41467-020-17581-y</ref> | *Disrupts [[Groundwater|groundwater]] recharge by altering the amount of soil [[Infiltration|infiltration]] (Wu et al., 2020)<ref>Wu, WY., Lo, MH., Wada, Y. 2020. Divergent effects of climate change on future groundwater availability in key mid-latitude aquifers. https://doi.org/10.1038/s41467-020-17581-y</ref> | ||
| + | *Alterations in freeze-thaw cycles (Sutherland Rolim Barbi et al., 2023)<ref>Sutherland Rolim Barbi, P., Tavassoti, P., & Tighe, S. L. (2023). Climate Change Impacts on Frost and Thaw Considerations: Case Study of Airport Pavement Design in Canada. Applied Sciences, 13(13), 7801. doi:10.3390/app13137801.</ref> | ||
*Changes in [[Nutrients|nutrient]] loading to waterbodies such as the Great Lakes (Fong et al., 2025; Robertson et al., 2016)<ref>Fong, P., Shrestha, R., Liu, Y., Valipour, R. 2025. Climate change impacts on hydrology and phosphorus loads under projected global warming levels for the Lake of the Woods watershed, Journal of Great Lakes Research. https://doi.org/10.1016/j.jglr.2025.102636.</ref><ref>Robertson, D., Saad, D., Christiansen, D., Lorenz, D. 2016. Simulated impacts of climate change on phosphorus loading to Lake Michigan. Journal of Great Lakes Research, Volume 42, Issue 3. https://doi.org/10.1016/j.jglr.2016.03.009 </ref> | *Changes in [[Nutrients|nutrient]] loading to waterbodies such as the Great Lakes (Fong et al., 2025; Robertson et al., 2016)<ref>Fong, P., Shrestha, R., Liu, Y., Valipour, R. 2025. Climate change impacts on hydrology and phosphorus loads under projected global warming levels for the Lake of the Woods watershed, Journal of Great Lakes Research. https://doi.org/10.1016/j.jglr.2025.102636.</ref><ref>Robertson, D., Saad, D., Christiansen, D., Lorenz, D. 2016. Simulated impacts of climate change on phosphorus loading to Lake Michigan. Journal of Great Lakes Research, Volume 42, Issue 3. https://doi.org/10.1016/j.jglr.2016.03.009 </ref> | ||
*Biodiversity loss and changes in species distribution (United Nations, 2025)<ref>United Nations. 2025. Biodiversity - our strongest natural defense against climate change. https://www.un.org/en/climatechange/science/climate-issues/biodiversity</ref> | *Biodiversity loss and changes in species distribution (United Nations, 2025)<ref>United Nations. 2025. Biodiversity - our strongest natural defense against climate change. https://www.un.org/en/climatechange/science/climate-issues/biodiversity</ref> | ||
| Line 12: | Line 14: | ||
*Economic impacts such as higher cooling costs and post-flood repairs (PPG, 2023b)<ref>Partners in Project Green. 2023. Impacts: Building and Infrastructure. https://partnersinprojectgreen.com/resources/impact-building-and-infrastructure/</ref>}} | *Economic impacts such as higher cooling costs and post-flood repairs (PPG, 2023b)<ref>Partners in Project Green. 2023. Impacts: Building and Infrastructure. https://partnersinprojectgreen.com/resources/impact-building-and-infrastructure/</ref>}} | ||
| − | <gallery mode="packed" widths= | + | <gallery mode="packed" widths=400 heights=250> |
File:Screenshot 2025-09-05 154920.png|As municipalities grapple with these new climate realities, they are rethinking how to manage stormwater. The Island Lake Reservoir, located near Orangeville, experienced low water levels after a prolonged drought. This was problematic for both the lake ecosystem and for the downstream WWTP which relies on reservoir discharges to dilute treated effluent (Tu et al., 2017)<ref>Tu, C., Milner, G., Lawrie, D., Shrestha, N., Hazen, S. 2017. Natural Systems Vulnerability to Climate Change in Peel Region. Technical Report. Toronto, Ontario: Toronto and Region Conservation Authority and Ontario Climate Consortium Secretariat. https://climateconnections.ca/app/uploads/2012/03/Final-Natural-Systems-VA.pdf</ref> | File:Screenshot 2025-09-05 154920.png|As municipalities grapple with these new climate realities, they are rethinking how to manage stormwater. The Island Lake Reservoir, located near Orangeville, experienced low water levels after a prolonged drought. This was problematic for both the lake ecosystem and for the downstream WWTP which relies on reservoir discharges to dilute treated effluent (Tu et al., 2017)<ref>Tu, C., Milner, G., Lawrie, D., Shrestha, N., Hazen, S. 2017. Natural Systems Vulnerability to Climate Change in Peel Region. Technical Report. Toronto, Ontario: Toronto and Region Conservation Authority and Ontario Climate Consortium Secretariat. https://climateconnections.ca/app/uploads/2012/03/Final-Natural-Systems-VA.pdf</ref> | ||
File:Radar_tracking_August_2012.png|Radar tracking of the August 10, 2012 extreme rainfall event. The Lake Ontario nearshore experienced sustained intensities approaching 200 mm/hr, while the southern portion of Peel Region had no measurable precipitation. (Source: Risk Sciences International) | File:Radar_tracking_August_2012.png|Radar tracking of the August 10, 2012 extreme rainfall event. The Lake Ontario nearshore experienced sustained intensities approaching 200 mm/hr, while the southern portion of Peel Region had no measurable precipitation. (Source: Risk Sciences International) | ||
| Line 18: | Line 20: | ||
==Climate change challenges for grey infrastructure & SWM== | ==Climate change challenges for grey infrastructure & SWM== | ||
| − | [[File:Screenshot 2025-08- | + | [[File:Screenshot 2025-08-28 143837.png|500px|thumb|right|Traditional grey infrastructure focused on conveying stormwater to end-of-pipe storage facilities is not resilient to climate change. Urban areas should be retrofitted with green infrastructure which uses a distributed network of stormwater features to [[filtration|filter]] and [[infiltration|infiltrate]] runoff at the source. Image adapted from Pennsylvania Wilds (2021) <ref>Pennsylvania Wilds. 2021. Just what is green infrastructure? https://pawilds.com/just-what-is-green-infrastructure/</ref>.]] |
| − | [[ | + | Stormwater dynamics are strongly influenced by land use and rainfall patterns, making them vulnerable to both climate change and [[Urbanization|urbanization]]. Canadian cities are experiencing climate change impacts at rates often exceeding the global average, as Canada is warming nearly twice as fast as the rest of the world (Bush & Lemmen, 2019)<ref>Bush, E., & Lemmen, D. 2019. Canada’s changing climate report.</ref>. Traditional stormwater systems that focus on efficiently conveying stormwater were designed based on historical climate conditions. However, urbanization and climate change have intensified surface runoff by way of more frequent and intensive rainfall occurrences and increased [[Natural drainage|impermeable]] land cover. This in turn creates challenges for urban drainage systems that lack sufficient adaptive capacity (Wang et al., 2023)<ref>Wang, M., Liu, M., Zhang, D., Zhang, Y., Su, J., Zhou, S., Bakhshipour, A., Tan, S. 2023. Assessing hydrological performance for optimized integrated grey-green infrastructure in response to climate change based on shared socio-economic pathways. Sustainable Cities and Society, Volume 91. https://doi.org/10.1016/j.scs.2023.104436 </ref>. Given these interconnected pressures, [[Definition of Low Impact Development|green infrastructure]] is increasingly essential for reducing flood risk, safeguarding [[Water quality|water quality]], and strengthening urban resilience. LID builds climate resilience by supplementing large [[SWM ponds|end-of-pipe ponds]] with a distributed network of smaller-scale stormwater features throughout the catchment to retain and treat runoff as close to the source as possible (Canada in a Changing Climate, 2018)<ref>Canada in a Changing Climate. 2018. Evaluation of Retrofitted Low Impact Development Practices for Stormwater Management at an Industrial Site. https://changingclimate.ca/map/evaluation-of-retrofitted-low-impact-development-practices-for-stormwater-management-at-an-industrial-site/</ref>. |
| + | |||
| + | |||
| + | Click on the button below to read a presentation on Urban Water Policies and Practices for a Changing Climate (2024).<ref>Neukrug, H. 2024. Urban Water Policies and Practices for a Changing Climate. Source to Stream Conference Presentation. https://sourcetostream.com/app/uploads/2024/04/S2S-Day-1-Track1-Presentation1.pdf</ref> | ||
| + | |||
| + | {{Clickable button|[[File:Screenshot 2025-08-29 161222.png|250px|link=https://sourcetostream.com/app/uploads/2024/04/S2S-Day-1-Track1-Presentation1.pdf]]}} | ||
| + | <br clear="all" /> | ||
| − | + | ===Storm events during various development phases & SWM controls=== | |
| + | |||
| + | [[File:Screenshot 2025-09-05 153152.png|800px]] | ||
| − | + | '''Histogram of rainfall during a typical storm event overlaid with hydrographs showing:''' | |
| − | + | *pre-development (blue) peak discharge is low and creates the least amount of runoff | |
| − | + | *post-development without SWM facilities (red) discharge responds quickly to rainfall and has high peak flow | |
| − | + | *post-development with an end-of-pipe SWM pond (green) discharge reaches the same peak flow as pre-development conditions but produces more runoff. | |
| − | |||
| − | + | The checkered yellow space between the blue and green lines shows the difference between the runoff volumes - this area is where LID can be used to reduce runoff by storing and infiltrating rainfall. Image credit: [[User: DanielFilippi|Daniel Filippi]]. | |
| − | |||
| − | |||
| − | |||
| − | |||
| − | |||
| − | |||
| − | |||
| − | |||
==Adapting to climate change using LID== | ==Adapting to climate change using LID== | ||
| − | [[File:Screenshot 2025-09-05 163005.png| | + | [[File:Adaptation vs. Mitigation ICLEI.jpg|500px|thumb|right|Adaptation and mitigation are two complementary strategies for addressing climate change: mitigation focuses on reducing greenhouse gas emissions to lessen future climate change, while adaptation involves adjusting to the current and future effects of climate change (Regional District of Nanaimo, ND)<ref>Regional District of Nanaimo. ND. Climate Change, Adaptation and Mitigation. http://rdn.bc.ca/climate-change-adaptation-and-mitigation</ref>.]] |
| + | [[File:Screenshot 2025-09-05 163005.png|500px|thumb|right|LID can help offset climate change impacts in urban environments (IISD, 2021) <ref>International Institute for Sustainable Development. 2021. Natural Infrastructure Solutions for Climate Resilience. https://www.iisd.org/articles/explainer/natural-infrastructure-solutions-climate-resilience</ref>.]] | ||
| + | [[File:Screenshot 2025-08-26 165331.png|500px|thumb|right| A variety of LID features distributed across a catchment addresses climate vulnerabilities more effectively than traditional grey infrastructure. Image adapted from the CT Stormwater Quality Manual (2025) <ref> CT Stormwater Quality Manual. 2025. LID Planning and Design Process. https://ctstormwatermanual.nemo.uconn.edu/lid-planning-and-design/</ref> ]] | ||
| + | ===Climate change adaptation=== | ||
Research highlights LID, such as [[bioretention]], [[infiltration]], and [[rainwater harvesting]], as a critical strategy for building climate-resilient cities. Studies show that LID can reduce runoff volumes during extreme events, decrease peak flows, reduce overflow of combined sewers, and promote [[Groundwater|groundwater]] recharge: | Research highlights LID, such as [[bioretention]], [[infiltration]], and [[rainwater harvesting]], as a critical strategy for building climate-resilient cities. Studies show that LID can reduce runoff volumes during extreme events, decrease peak flows, reduce overflow of combined sewers, and promote [[Groundwater|groundwater]] recharge: | ||
*Modelled [[green roofs]], [[permeable pavements]], and [[bioretention]] cells were shown to increase resilience against combined sewer overflows during heavy future rainfall, helping prevent untreated sewage from being released (Rodriguez et al., 2024)<ref>Rodríguez, M., Fu, G., Butler, D., Yuan, Z., & Cook, L. 2024. The effect of green infrastructure on resilience performance in combined sewer systems under climate change. Journal of Environmental Management, 353, 120229. https://doi.org/10.1016/j.jenvman.2024.120229</ref>. | *Modelled [[green roofs]], [[permeable pavements]], and [[bioretention]] cells were shown to increase resilience against combined sewer overflows during heavy future rainfall, helping prevent untreated sewage from being released (Rodriguez et al., 2024)<ref>Rodríguez, M., Fu, G., Butler, D., Yuan, Z., & Cook, L. 2024. The effect of green infrastructure on resilience performance in combined sewer systems under climate change. Journal of Environmental Management, 353, 120229. https://doi.org/10.1016/j.jenvman.2024.120229</ref>. | ||
| Line 50: | Line 54: | ||
*Vegetated LID features, such as [[green roofs]] and [[Swales|treed bioswales]], provide natural cooling that helps regulate urban temperatures and reduce energy demand and costs (ECONorthwest, 2007)<ref>ECONorthwest. 2007. The Economics of Low-Impact Development: A Literature Review. https://www.epa.gov/sites/default/files/documents/LID_Economics_Literature_Review.pdf </ref>. | *Vegetated LID features, such as [[green roofs]] and [[Swales|treed bioswales]], provide natural cooling that helps regulate urban temperatures and reduce energy demand and costs (ECONorthwest, 2007)<ref>ECONorthwest. 2007. The Economics of Low-Impact Development: A Literature Review. https://www.epa.gov/sites/default/files/documents/LID_Economics_Literature_Review.pdf </ref>. | ||
| + | ===LID co-benefits for climate change=== | ||
Although LID BMPs are primarily designed to manage water quantity and [[water quality|quality]], they also provide additional co-benefits for climate adaptation: | Although LID BMPs are primarily designed to manage water quantity and [[water quality|quality]], they also provide additional co-benefits for climate adaptation: | ||
*Gill et al. (2007) demonstrated that increasing urban greenspace by 10% by installing [[green roofs]] could offset projected urban heat increases until the 2080s<ref>Gill, S. Handley, J.F. Ennos, R., Pauleit, S. 2007. Adapting Cities for Climate Change: The Role of the Green Infrastructure. Built Environment. 33. 115-133. DOI:10.2148/benv.33.1.115 </ref>. | *Gill et al. (2007) demonstrated that increasing urban greenspace by 10% by installing [[green roofs]] could offset projected urban heat increases until the 2080s<ref>Gill, S. Handley, J.F. Ennos, R., Pauleit, S. 2007. Adapting Cities for Climate Change: The Role of the Green Infrastructure. Built Environment. 33. 115-133. DOI:10.2148/benv.33.1.115 </ref>. | ||
*New York City’s Green Infrastructure Plan, launched in 2010, uses [[green roofs]], [[rain gardens]], and [[permeable pavements]] to reduce combined sewer overflows and improve [[water quality]]. By 2020, over 5,000 projects were managing more than 760 million liters of stormwater annually. Beyond stormwater benefits, these projects also improve air quality, support biodiversity, and create green spaces in underserved communities (Montazeri, 2024)<ref>Montazeri , B. 2024. A Comparative Study of LID, Suds, and Sponge City Strategies: Case Study of Melbourne. Masters’s Thesis, Politecnico di Torino. https://webthesis.biblio.polito.it/secure/32417/1/tesi.pdf </ref>. | *New York City’s Green Infrastructure Plan, launched in 2010, uses [[green roofs]], [[rain gardens]], and [[permeable pavements]] to reduce combined sewer overflows and improve [[water quality]]. By 2020, over 5,000 projects were managing more than 760 million liters of stormwater annually. Beyond stormwater benefits, these projects also improve air quality, support biodiversity, and create green spaces in underserved communities (Montazeri, 2024)<ref>Montazeri , B. 2024. A Comparative Study of LID, Suds, and Sponge City Strategies: Case Study of Melbourne. Masters’s Thesis, Politecnico di Torino. https://webthesis.biblio.polito.it/secure/32417/1/tesi.pdf </ref>. | ||
*LID practices contribute to climate change mitigation by sequestering carbon (Haque et al., 2025)<ref>Haque, M. T., Geronimo, F. K. F., Robles, M. E. L., Vispo, C., & Kim, L.-H. 2025. Comparative evaluation of the carbon storage capacities in urban stormwater nature-based technologies. Ecological Engineering, 212, 107539. https://doi.org/10.1016/j.ecoleng.2025.107539</ref>. | *LID practices contribute to climate change mitigation by sequestering carbon (Haque et al., 2025)<ref>Haque, M. T., Geronimo, F. K. F., Robles, M. E. L., Vispo, C., & Kim, L.-H. 2025. Comparative evaluation of the carbon storage capacities in urban stormwater nature-based technologies. Ecological Engineering, 212, 107539. https://doi.org/10.1016/j.ecoleng.2025.107539</ref>. | ||
| − | |||
| − | |||
| − | |||
| − | |||
These stormwater benefits and additional ecosystem services position LID as essential tools for cities facing intensifying climate change impacts. | These stormwater benefits and additional ecosystem services position LID as essential tools for cities facing intensifying climate change impacts. | ||
| Line 72: | Line 73: | ||
*Jarden et al., 2015 demonstrated that catchment-scale retrofits, such as a combination of street-connected [[bioretention]] cells (with and without [[underdrains]]), [[rain gardens]], and [[rain barrels]], can significantly reduce peak flows<ref>Jarden, Kimberly M., Anne J. Jefferson, and Jennifer M. Grieser. 2015. Assessing the Effects of Catchment-Scale Urban Green Infrastructure Retrofits on Hydrograph Characteristics. Hydrological Processes 30 (10):1536–50. https://doi.org/10.1002/hyp.10736 </ref>. | *Jarden et al., 2015 demonstrated that catchment-scale retrofits, such as a combination of street-connected [[bioretention]] cells (with and without [[underdrains]]), [[rain gardens]], and [[rain barrels]], can significantly reduce peak flows<ref>Jarden, Kimberly M., Anne J. Jefferson, and Jennifer M. Grieser. 2015. Assessing the Effects of Catchment-Scale Urban Green Infrastructure Retrofits on Hydrograph Characteristics. Hydrological Processes 30 (10):1536–50. https://doi.org/10.1002/hyp.10736 </ref>. | ||
*A [[rainwater harvesting|cistern]]/irrigation system and [[Infiltration chambers|soakaway ponds]]/infiltration trench retrofitted into an industrial-commercial lot in Toronto reduced runoff volume from their roof drainage areas by 64% (~650 m<sup>2</sup> roof area) and 89% (~204 m<sup>2</sup> roof area), respectively (STEP, 2019)<ref name = CALSTONE></ref>. | *A [[rainwater harvesting|cistern]]/irrigation system and [[Infiltration chambers|soakaway ponds]]/infiltration trench retrofitted into an industrial-commercial lot in Toronto reduced runoff volume from their roof drainage areas by 64% (~650 m<sup>2</sup> roof area) and 89% (~204 m<sup>2</sup> roof area), respectively (STEP, 2019)<ref name = CALSTONE></ref>. | ||
| + | |||
| + | [[File:Screenshot 2025-09-04 120521.png|500px|]]<br> | ||
| + | </br> | ||
| + | As referenced above, a stormwater retrofit project that took place at Calstone Inc., located in Scarborough ON., was designed to capture roof runoff, and then directing it toward enhanced green space, irrigating landscaped areas, and infiltrating stormwater onsite. This system diverts water from the municipal storm sewer, strengthening watershed resilience to climate change. With aging stormwater infrastructure in the area that no longer meets current standards, this project serves as a showcase for lot-level LID retrofits (STEP, 2019)<ref name = CALSTONE>STEP. 2019. Evaluation of Retrofitted Stormwater Source Control Practices, Calstone Inc., Toronto. https://sustainabletechnologies.ca/home/urban-runoff-green-infrastructure/low-impact-development/evaluation-retrofitted-stormwater-source-control-practices-calstone-inc-toronto/</ref>. | ||
==Tailoring LID features to climate change== | ==Tailoring LID features to climate change== | ||
| − | |||
{{textbox|Canadian cities typically experience three types of rainfall (City of Vancouver, 2025)<ref>City of Vancouver. 2025. Climate adaptation and rainwater management. https://vancouver.ca/green-vancouver/climate-adaptation-and-rainwater-management.aspx </ref>: | {{textbox|Canadian cities typically experience three types of rainfall (City of Vancouver, 2025)<ref>City of Vancouver. 2025. Climate adaptation and rainwater management. https://vancouver.ca/green-vancouver/climate-adaptation-and-rainwater-management.aspx </ref>: | ||
| Line 82: | Line 86: | ||
Most precipitation events fall into the first category. However, climate change is intensifying storm severity, shifting more events into the second and third categories. One study reported increases in the intensity of 20- and 50-year return period winter precipitation events across the western United States. Another study projected rising intensity of annual maximum precipitation in Canada, with the greatest increases expected in Ontario, the Prairies, and Southern Quebec (Guinard et al., 2015)<ref>Guinard, K., Mailhot, A. and Caya, D. 2015. Projected Changes in Characteristics of Precipitation Spatial Structures over North America. International Journal of Climatology 35 (4):596–612. https://doi.org/10.1002/joc.4006 </ref>. As these storm events grow more frequent and intense, much of our infrastructure faces conditions it was never designed to withstand (Government of Ontario, 2012)<ref>Government of Ontario. 2012. Climate Ready: Ontario’s Adaptation Strategy and Action Plan. Ministry of the Environment, 124p. </ref>. To remain effective, the design of LID features must account for these changing precipitation patterns. Go to [[Understanding rainfall statistics]] to learn more about rain event distributions. | Most precipitation events fall into the first category. However, climate change is intensifying storm severity, shifting more events into the second and third categories. One study reported increases in the intensity of 20- and 50-year return period winter precipitation events across the western United States. Another study projected rising intensity of annual maximum precipitation in Canada, with the greatest increases expected in Ontario, the Prairies, and Southern Quebec (Guinard et al., 2015)<ref>Guinard, K., Mailhot, A. and Caya, D. 2015. Projected Changes in Characteristics of Precipitation Spatial Structures over North America. International Journal of Climatology 35 (4):596–612. https://doi.org/10.1002/joc.4006 </ref>. As these storm events grow more frequent and intense, much of our infrastructure faces conditions it was never designed to withstand (Government of Ontario, 2012)<ref>Government of Ontario. 2012. Climate Ready: Ontario’s Adaptation Strategy and Action Plan. Ministry of the Environment, 124p. </ref>. To remain effective, the design of LID features must account for these changing precipitation patterns. Go to [[Understanding rainfall statistics]] to learn more about rain event distributions. | ||
| + | [[File:Screenshot 2025-09-04 125210.png|900px|center|]] | ||
| + | <small>During Hurricane Hazel (a devastating event in 1954 where 81 lives were lost), the two-hour maximum precipitation was 91 mm and the total amount of rainfall was 285 mm over nearly two days (Toronto Star, 2013)<ref>Toronto Star. 2013. Monday’s storm vs. Hurricane Hazel. http://www.thestar.com/opinion/letters_to_the_editors/2013/07/14/mondays_storm_vs_hurricane_hazel.html </ref>. Conventional municipal drainage systems could not carry stormwater away fast enough; roads and highways were overcome with floodwater closing major transportation corridors, GO Train passengers were stranded, and power outages and basement flooding were widespread with property damage of more than $1 billion (Upadhyaya et al., 2014). Hurricane Hazel served as a catalyst for change, revealing the urgent need for an overhaul of flood management practices (TRCA, 2024)<ref>TRCA. 2024. Hurricane Hazel’s Legacy. https://trca.ca/news/hurricane-hazel-70-years/</ref>. Hurricane Hazel was larger than the 100-year design storm (Institute for Catastrophic Loss Reduction, 2000)<ref>Institute for Catastrophic Loss Reduction. 2000. Hurricane Hazel and Extreme Rainfall In Southern Ontario. https://www.iclr.org/wp-content/uploads/PDFS/hurricane-hazel-and-extreme-rainfall-in-southern-ontario.pdf.</ref>.</small><br> | ||
| + | <br> | ||
| − | + | {{:Intensity-Duration-Frequency Curves}} | |
| − | |||
| − | |||
| − | |||
| − | |||
| − | |||
| − | |||
| − | |||
| − | |||
| − | |||
| − | |||
| − | |||
| − | |||
| − | |||
| − | |||
===Estimating future rainfall=== | ===Estimating future rainfall=== | ||
| − | |||
When designing infrastructure with a service life longer than 10 years, future IDF curves must account for climate change impacts on the frequency and intensity of extreme rainfall. Future precipitation patterns are estimated to account for climate change impacts. | When designing infrastructure with a service life longer than 10 years, future IDF curves must account for climate change impacts on the frequency and intensity of extreme rainfall. Future precipitation patterns are estimated to account for climate change impacts. | ||
| Line 106: | Line 98: | ||
<math>I_{fut,D,RT} = I_{ref,D,RT} \times (CC_{adj})^{\Delta T}</math> | <math>I_{fut,D,RT} = I_{ref,D,RT} \times (CC_{adj})^{\Delta T}</math> | ||
| − | + | {{plainlist|1=Where | |
| − | + | * <math style="display:inline">I_{fut,D,RT}</math>: the median estimate of the projected future rainfall intensity of duration ''D'' and return period ''RT'' | |
| − | + | * <math>I_{ref,D,RT}</math>: historical rainfall intensity, obtained from IDF data produced by [https://climate.weather.gc.ca/prods_servs/engineering_e.html Environment and Climate Change Canada] using stations that are representative of the project site location and have at least 10 years of complete and validated observations. Refer to [https://www.csagroup.org/store/product/2431590/?srsltid=AfmBOop-F2g5zuHESVcAjvrdPKhgh8Yr2pvKZnqaH97tkLZBCvc-TOCB CSA 231:25] for details on calculating from alternative sources of rainfall observations, if required. | |
| − | + | * <math>CC_{adj}</math>: the rainfall-temperature scaling factor (typically 1.07 unless otherwise justified) | |
| − | + | * <math>\Delta T</math>: the projected change in local temperature (°C) between the reference and future time periods. Read Chapter 5 of [https://www.csagroup.org/store/product/2431590/?srsltid=AfmBOopkRT3cosyCstZMacCmlthJxgfo6w6aFIXyuEExGmyBT8zw1vMs CSA 231:25 Developing and interpreting intensity-duration-frequency (IDF) information under a changing climate] for more details on calculating <math>\Delta T</math>.}} | |
| − | |||
| − | |||
| − | |||
| − | |||
| − | |||
| − | |||
[[File:Screenshot 2025-08-29 140530.png|400px|thumb|right|Risk thresholds are a useful tool when prioritizing climate change impact management efforts. Low impact and low frequency events may not require management planning, while high impact and high frequency events require adaptation strategies (MECP, 2022)<ref name = MECP2022>Ministry of the Environment, Conservation and Parks (MECP). 2022. Low Impact Development Stormwater Management Guidance Manual. https://ero.ontario.ca/public/2022-01/Draft%20LID%20Stormwater%20Management%20Guidance%20Manual%202022.pdf</ref>]] | [[File:Screenshot 2025-08-29 140530.png|400px|thumb|right|Risk thresholds are a useful tool when prioritizing climate change impact management efforts. Low impact and low frequency events may not require management planning, while high impact and high frequency events require adaptation strategies (MECP, 2022)<ref name = MECP2022>Ministry of the Environment, Conservation and Parks (MECP). 2022. Low Impact Development Stormwater Management Guidance Manual. https://ero.ontario.ca/public/2022-01/Draft%20LID%20Stormwater%20Management%20Guidance%20Manual%202022.pdf</ref>]] | ||
| + | ====External Sources on Climate Change & IDF Curves==== | ||
To read about IDF curves and best practices, learn how to integrate climate change into IDF curves, and download climate change-scaled IDF data, visit: | To read about IDF curves and best practices, learn how to integrate climate change into IDF curves, and download climate change-scaled IDF data, visit: | ||
*https://climatedata.ca/interactive/idf-curves-101/ | *https://climatedata.ca/interactive/idf-curves-101/ | ||
| Line 125: | Line 112: | ||
*https://climatedata.ca/resource/best-practices-for-using-idf-curves/ | *https://climatedata.ca/resource/best-practices-for-using-idf-curves/ | ||
*https://www.csagroup.org/store/product/2705526/?srsltid=AfmBOooZzvRihuxPEkbonAPD3jtG2dFxd5Y-lAFFop5O8Yq4e9ZQggd8 | *https://www.csagroup.org/store/product/2705526/?srsltid=AfmBOooZzvRihuxPEkbonAPD3jtG2dFxd5Y-lAFFop5O8Yq4e9ZQggd8 | ||
| + | *https://www.idf-cc-uwo.ca/whatsnew | ||
| + | *https://www2.gov.bc.ca/assets/gov/farming-natural-resources-and-industry/natural-resource-use/resource-roads/climate-change-adaptation/pcic_fpi_talk_031022_v4.pdf | ||
| + | *https://www.icwmm.org/files/2025-C034-24.pdf | ||
| + | *https://sourcetostream.com/app/uploads/2016/07/9-F-2-Tonto-Fausto-State-of-Climate-Science-and-Practice-in-ON.pdf<br> | ||
| + | <br> | ||
===Climate risk and uncertainty=== | ===Climate risk and uncertainty=== | ||
| − | + | ====Risk==== | |
| − | |||
Risk is typically defined as a combination of the likelihood of failure and the consequences of that failure. More detailed frameworks also consider hazard (what could trigger damage), exposure (what is at stake), vulnerability (sensitivity to hazards), and resulting consequences. In the context of climate change, risk is often expressed as (CSA, 2024)<ref name = CSA2024>CSA. 2024. CSA W204:19: Flood resilient design of new residential communities. https://www.csagroup.org/store/product/CSA%20W204:19/?srsltid=AfmBOooJ2nREEVk6Fsc11wguYzUVcJEYsh3gKVx3-UH876ldmcfR0kYL</ref>: | Risk is typically defined as a combination of the likelihood of failure and the consequences of that failure. More detailed frameworks also consider hazard (what could trigger damage), exposure (what is at stake), vulnerability (sensitivity to hazards), and resulting consequences. In the context of climate change, risk is often expressed as (CSA, 2024)<ref name = CSA2024>CSA. 2024. CSA W204:19: Flood resilient design of new residential communities. https://www.csagroup.org/store/product/CSA%20W204:19/?srsltid=AfmBOooJ2nREEVk6Fsc11wguYzUVcJEYsh3gKVx3-UH876ldmcfR0kYL</ref>: | ||
''Risk = (Probability of Climate Event) × (Probability of Asset Failure Given Event) × (Consequences: a function of exposure and vulnerability)'' | ''Risk = (Probability of Climate Event) × (Probability of Asset Failure Given Event) × (Consequences: a function of exposure and vulnerability)'' | ||
| − | Not all risks can be fully managed; therefore, management efforts are typically prioritized toward impacts that exceed established thresholds of severity and frequency | + | Not all risks can be fully managed; therefore, management efforts are typically prioritized toward impacts that exceed established thresholds of severity and frequency (MECP, 2022). |
| − | Climate change is inherently characterized by uncertainty, particularly in projecting local impacts. This uncertainty poses challenges for engineers, making risk management a critical tool for prioritizing vulnerabilities and selecting effective risk reduction strategies. Uncertainty surrounding climate impacts underscores the need to build resilience through LID practices (MECP, 2022). The [[No regrets|”no regrets”]] strategy refers to actions, such as LID, that have positive benefits for people and the environment, regardless of how climate change unfolds. | + | ====Uncertainty==== |
| + | [[File:Screenshot 2025-08-29 144313.png|500px|thumb|right|Historical (grey) global surface temperature compared to a range of projected future surface temperatures based on five emission scenarios (from very low to very high). Not only is the state of future emissions uncertain, but there is also uncertainty associated with each scenario – indicated by the red and blue shaded areas (City of Toronto, 2024)<ref>City of Toronto. 2024. Toronto’s Current and Future Climate. https://www.toronto.ca/wp-content/uploads/2024/12/949f-TorontosCurrentandFutureClimate-REPORT-Final.pdf</ref>]] | ||
| + | |||
| + | Climate change is inherently characterized by uncertainty, particularly in projecting local impacts. This uncertainty poses challenges for engineers, making risk management a critical tool for prioritizing vulnerabilities and selecting effective risk reduction strategies. Uncertainty surrounding climate impacts underscores the need to build resilience through LID practices (MECP, 2022). The [[No regrets|”no regrets”]] strategy refers to actions, such as LID, that have positive benefits for people and the environment, regardless of how climate change unfolds.<br> | ||
| + | <br> | ||
===Planning for climate change in LID design=== | ===Planning for climate change in LID design=== | ||
| Line 142: | Line 137: | ||
#Evaluating risk caused by climate change parameters | #Evaluating risk caused by climate change parameters | ||
#Climate change impact management planning | #Climate change impact management planning | ||
| − | #Monitoring and adaptive management | + | #Monitoring and adaptive management<br> |
| + | |||
| + | |||
| + | To learn more about each step and access climate assessment templates, Please select the clickable button below and read '''[https://ero.ontario.ca/public/2022-01/Draft%20LID%20Stormwater%20Management%20Guidance%20Manual%202022.pdf Chapter 6 of the Draft LID Stormwater Management Guidance Manual]''', written by MECP in 2022<ref name = MECP2022></ref>. | ||
| + | |||
| + | |||
| + | {{Clickable button|[[File:MECP logo.JPG|250px|link=https://ero.ontario.ca/public/2022-01/Draft%20LID%20Stormwater%20Management%20Guidance%20Manual%202022.pdf]]}} | ||
| + | |||
| + | <div style="overflow: hidden;"> | ||
| + | |||
| + | <div style="float: right; padding-left: 20px; padding-bottom: 10px;"> | ||
| + | <pdf width="450" height="600">File:NIHMS1800634-supplement-SI.pdf</pdf> | ||
| + | </div> | ||
| − | + | Besides increasing the size of LID features using updated IDF curves to reflect changing rainfall patterns, studies have also proposed various considerations and adaptation strategies for LID design in the face of climate change. Read examples linked in the table below. A more extensive list of BMPs, climactic sensitivities, and adaption potential from supplementary information provided in an article by Johnson et al. (2022) <ref>Johnson, T., Butcher, J., Santell, S., Schwartz, S., Julius, S., & LeDuc, S. (2022). A review of climate change effects on practices for mitigating water quality impacts. Journal of Water and Climate Change, 13(4), 1684-1705. https://doi.org/10.2166/wcc.2022.363</ref> is available as a PDF on the right for download (downward facing arrow on the top righthand side) and printing (printer emoticon on top right hand side). | |
| − | + | {| class="wikitable" | |
| + | ! Application | ||
| + | ! Literature | ||
| + | |- | ||
| + | | [[Vegetation|Vegetated]] LID | ||
| + | | | ||
| + | *Sousa et al. (2016)<ref>Catalano de Sousa, M. R., Franco, A. M., & Palmer, M. I. (2016). Potential climate change impacts on green infrastructure vegetation. Urban Forestry & Urban Greening, 20, 128–139. https://doi.org/10.1016/j.ufug.2016.08.014 | ||
| + | </ref> tested how two [[Plant lists|plant]] species commonly used in northeastern United States green-infrastructure installations, [https://www.wildflower.org/plants/result.php?id_plant=CALU5 ''Carex lurida'' (sallow sedge)] and [https://plants.ces.ncsu.edu/plants/liriope-muscari/ ''Liriope muscari'' (lilyturf)], respond to repeated drought and flood conditions expected under climate change. Both species tolerated flooding well, but drought caused more stress, reduced stomatal conductance, and significantly lowered biomass, especially for ''Carex lurida''. Overall, both species survived repeated stress cycles, suggesting they remain viable for future GI installations, though drought posed the greater risk to performance. However, STEP does not recommend ''Liriope muscari'' for use in LID projects in Ontario, as it is not native and can exhibit invasive tendencies. | ||
| + | |- | ||
| + | | [[Green roofs|Green]] and [[blue roofs]] | ||
| + | | | ||
| + | *A study based in Toronto predicted that there could a decrease in peak flow reduction provided by green roofs in the future (Guram & Bashir, 2024) <ref name=Guram>Guram, S., & Bashir, R. (2024). Designing effective low-impact developments for a changing climate: A HYDRUS-based vadose zone modeling approach. Water, 16(13), 1803. https://doi.org/10.3390/w16131803</ref>. | ||
| + | *Knappe et al. (2023) <ref>Knappe, S., van Afferden, M., & Friesen, J. (2023). GR2L: A robust dual-layer green roof water balance model to assess multifunctionality aspects under climate variability. Frontiers in Climate, 5, Article 1115595. https://doi.org/10.3389/fclim.2023.1115595</ref> modelled dual-layer (upper vegetated substrate layer and a lower retention layer separated by a distribution fleece) roof designs to investigate water balance outcomes (storage, outflow, evapotranspiration) under wet and dry climactic extremes. During extreme climate years in Germany, the roof with the largest retention volume was estimated to provide more evaporative cooling and retention of heavy rainfall events without outflow in summer, demonstrating potential for a more climate-resilient design. | ||
| + | |- | ||
| + | |[[Bioretention]] | ||
| + | | | ||
| + | *Hydrological performance of bioretention systems may decrease as changing rainfall patterns in Ontario increase ponding depth and time (Guram & Bashir, 2024) <ref name=Guram>Guram, S., & Bashir, R. (2024). Designing effective low-impact developments for a changing climate: A HYDRUS-based vadose zone modeling approach. Water, 16(13), 1803. https://doi.org/10.3390/w16131803</ref>. | ||
| + | *Bioretention cell performance was simulated by Tirpak et al. (2021) <ref> Tirpak, R. A., Hathaway, J. M., Khojandi, A., Weathers, M., & Epps, T. H. (2021). Building resiliency to climate change uncertainty through bioretention design modifications. Journal of Environmental Management, 287, 112300. https://doi.org/10.1016/j.jenvman.2021.112300</ref> using the USEPA Storm Water Management Model to evaluate how design modifications could enhance system resilience under future climate conditions projected for Knoxville, Tennessee. Results show that expanding the bioretention surface area relative to the contributing catchment yields the strongest performance benefits under future climate conditions, especially in areas with low native soil infiltration rate. | ||
| + | |- | ||
| + | |[[Permeable pavements]] | ||
| + | | | ||
| + | *Kia et al. (2022)<ref>Kia, A., Wong, H. S., & Cheeseman, C. R. (2022). Freeze–thaw durability of conventional and novel permeable pavement replacement. Journal of Transportation Engineering Part B: Pavements, 148(4). https://doi.org/10.1061/JPEODX.0000395</ref> propose a novel high-strength clogging-resistant permeable pavement replacement which is more resistant to degradation caused by freeze–thaw cycles than a conventional permeable concrete. | ||
| + | |- | ||
| + | |[[Filter strips]] | ||
| + | | | ||
| + | *A study in the Lake Erie watershed predicted that with stronger springtime precipitation events included in future climate conditions, filter strips are likely to be inundated with runoff carrying more sediment and nutrients, reducing their buffering capacity (Bosch et al., 2014) <ref>Bosch, O. J. H., King, C. A., Herbohn, J. L., Russell, I. W., & Smith, C. S. (2014). Interacting effects of climate change and agricultural best-management practices on nutrient and sediment runoff entering Lake Erie. Agriculture, Ecosystems & Environment, 184, 106–114. https://doi.org/10.1016/j.agee.2013.11.016</ref>. | ||
| + | |- | ||
| + | |Watershed planning | ||
| + | | | ||
| + | *A Nordic study demonstrated that over time, more LID units and higher LID area coverage will be needed within a catchment to offset summer runoff as climate change progresses (Natale et al., 2023)<ref>Di Natale, C. M., Tamm, O., & Koivusalo, H. (2023). Climate change adaptation using low impact development for stormwater management in a Nordic catchment. Boreal Environment Research, 28, 243–258. https://www.borenv.net/BER/archive/pdfs/ber28/ber28-243-258.pdf</ref>. | ||
| + | |- | ||
| + | |[[Inspections and maintenance]] | ||
| + | | | ||
| + | * A study in Toronto noted that vegetated LIDs may need more irrigation to avoid wilting, since the water availability in the root zone might decrease from historical levels (Guram & Bashir, 2024) <ref name=Guram>Guram, S., & Bashir, R. (2024). Designing effective low-impact developments for a changing climate: A HYDRUS-based vadose zone modeling approach. Water, 16(13), 1803. https://doi.org/10.3390/w16131803</ref>. | ||
| + | *Modify bioretention maintenance and media replacement frequencies based on changes in decay rates, and humidity distribution (Johnson et al., 2022) <ref>Johnson, T., Butcher, J., Santell, S., Schwartz, S., Julius, S., & LeDuc, S. (2022). A review of climate change effects on practices for mitigating water quality impacts. Journal of Water and Climate Change, 13(4), 1684-1705. https://doi.org/10.2166/wcc.2022.363</ref>. | ||
| + | |} | ||
==Climate planning at different scales== | ==Climate planning at different scales== | ||
Latest revision as of 21:59, 18 November 2025
Overview[edit]
Climate change refers to long-term alterations in temperature, precipitation, wind patterns, and other aspects of the Earth’s climate system, largely driven by human activities. The dominant cause is the increased concentration of greenhouse gases, primarily from fossil fuel combustion, industrial processes, and land-use change (IPCC, 2021)[2].
Impacts of climate change include:
- Changing rainfall patterns lead to more frequent extreme precipitation events which increase the risk of flooding (Foster et al., 2011)[3]
- Increased temperature worsens heatwaves, which are compounded with the urban heat island effect and increased drought length and intensity (Foster et al., 2011)[3]
- Disrupts groundwater recharge by altering the amount of soil infiltration (Wu et al., 2020)[4]
- Alterations in freeze-thaw cycles (Sutherland Rolim Barbi et al., 2023)[5]
- Changes in nutrient loading to waterbodies such as the Great Lakes (Fong et al., 2025; Robertson et al., 2016)[6][7]
- Biodiversity loss and changes in species distribution (United Nations, 2025)[8]
- Health impacts such as heat related illness during heatwaves (PPG, 2023a)[9]
- Economic impacts such as higher cooling costs and post-flood repairs (PPG, 2023b)[10]
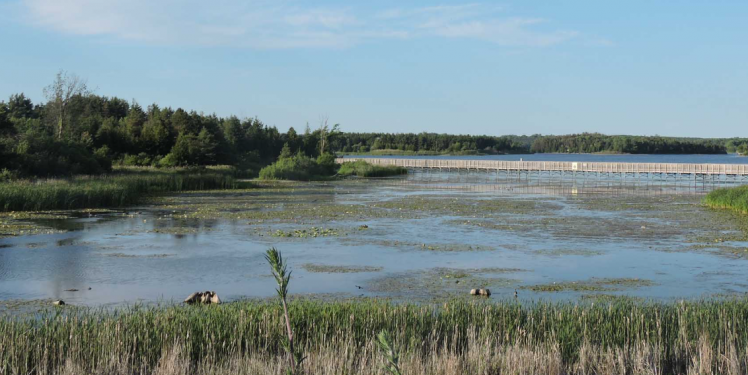
As municipalities grapple with these new climate realities, they are rethinking how to manage stormwater. The Island Lake Reservoir, located near Orangeville, experienced low water levels after a prolonged drought. This was problematic for both the lake ecosystem and for the downstream WWTP which relies on reservoir discharges to dilute treated effluent (Tu et al., 2017)[11]
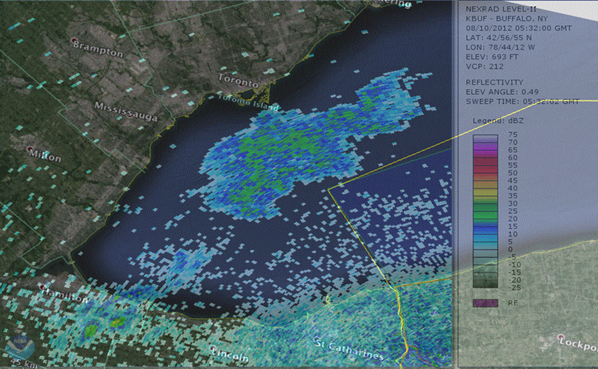
Radar tracking of the August 10, 2012 extreme rainfall event. The Lake Ontario nearshore experienced sustained intensities approaching 200 mm/hr, while the southern portion of Peel Region had no measurable precipitation. (Source: Risk Sciences International)

Climate change challenges for grey infrastructure & SWM[edit]

Stormwater dynamics are strongly influenced by land use and rainfall patterns, making them vulnerable to both climate change and urbanization. Canadian cities are experiencing climate change impacts at rates often exceeding the global average, as Canada is warming nearly twice as fast as the rest of the world (Bush & Lemmen, 2019)[13]. Traditional stormwater systems that focus on efficiently conveying stormwater were designed based on historical climate conditions. However, urbanization and climate change have intensified surface runoff by way of more frequent and intensive rainfall occurrences and increased impermeable land cover. This in turn creates challenges for urban drainage systems that lack sufficient adaptive capacity (Wang et al., 2023)[14]. Given these interconnected pressures, green infrastructure is increasingly essential for reducing flood risk, safeguarding water quality, and strengthening urban resilience. LID builds climate resilience by supplementing large end-of-pipe ponds with a distributed network of smaller-scale stormwater features throughout the catchment to retain and treat runoff as close to the source as possible (Canada in a Changing Climate, 2018)[15].
Click on the button below to read a presentation on Urban Water Policies and Practices for a Changing Climate (2024).[16]

Storm events during various development phases & SWM controls[edit]

Histogram of rainfall during a typical storm event overlaid with hydrographs showing:
- pre-development (blue) peak discharge is low and creates the least amount of runoff
- post-development without SWM facilities (red) discharge responds quickly to rainfall and has high peak flow
- post-development with an end-of-pipe SWM pond (green) discharge reaches the same peak flow as pre-development conditions but produces more runoff.
The checkered yellow space between the blue and green lines shows the difference between the runoff volumes - this area is where LID can be used to reduce runoff by storing and infiltrating rainfall. Image credit: Daniel Filippi.
Adapting to climate change using LID[edit]


Climate change adaptation[edit]
Research highlights LID, such as bioretention, infiltration, and rainwater harvesting, as a critical strategy for building climate-resilient cities. Studies show that LID can reduce runoff volumes during extreme events, decrease peak flows, reduce overflow of combined sewers, and promote groundwater recharge:
- Modelled green roofs, permeable pavements, and bioretention cells were shown to increase resilience against combined sewer overflows during heavy future rainfall, helping prevent untreated sewage from being released (Rodriguez et al., 2024)[20].
- LID with controlled outlets outperformed traditional grey infrastructure to decrease peak flow reduction and overflow volume which helps minimize nuisance flooding and erosive flows. LID was more resilient to increased flow intensity from climate change than grey infrastructure (Lucas and Sample, 2015)[21].
- Vogel et al. (2015) documented that the use of LID in New York and Minnesota have the potential to reduce flood risks under climate change scenarios[22].
- Infiltration-based LID practices promoted groundwater recharge during climate change-adjusted design storms more effectively than conventional SWM (Barbu et al., 2009)[23].
- Vegetated LID features, such as green roofs and treed bioswales, provide natural cooling that helps regulate urban temperatures and reduce energy demand and costs (ECONorthwest, 2007)[24].
LID co-benefits for climate change[edit]
Although LID BMPs are primarily designed to manage water quantity and quality, they also provide additional co-benefits for climate adaptation:
- Gill et al. (2007) demonstrated that increasing urban greenspace by 10% by installing green roofs could offset projected urban heat increases until the 2080s[25].
- New York City’s Green Infrastructure Plan, launched in 2010, uses green roofs, rain gardens, and permeable pavements to reduce combined sewer overflows and improve water quality. By 2020, over 5,000 projects were managing more than 760 million liters of stormwater annually. Beyond stormwater benefits, these projects also improve air quality, support biodiversity, and create green spaces in underserved communities (Montazeri, 2024)[26].
- LID practices contribute to climate change mitigation by sequestering carbon (Haque et al., 2025)[27].
These stormwater benefits and additional ecosystem services position LID as essential tools for cities facing intensifying climate change impacts.
Watershed scale approaches to LID[edit]
Watershed-scale implementation of LID is more effective than isolated measures, as single installations rarely address all climate risks. Combining multiple BMPs that are tailored to a site’s vulnerabilities in a treatment train approach creates broader urban climate resilience.
- Ayalew et al. (2015) demonstrated that distributed stormwater retention ponds provide more widespread flood control benefits across a catchment than a single large pond at the outlet [28].
- Hydrological models show that combinations of rain barrels and rain gardens reduce runoff more than either LID alone (Neupane et al., 2021)[29].
Retrofitting[edit]
Urban areas are constantly changing, and activities such as sewer upgrades and building renovations create opportunities to retrofit LID BMPs. Coordinating climate adaptation measures with these activities can help lower overall project implementation costs (Voskamp et al., 2015)[30].
- Jarden et al., 2015 demonstrated that catchment-scale retrofits, such as a combination of street-connected bioretention cells (with and without underdrains), rain gardens, and rain barrels, can significantly reduce peak flows[31].
- A cistern/irrigation system and soakaway ponds/infiltration trench retrofitted into an industrial-commercial lot in Toronto reduced runoff volume from their roof drainage areas by 64% (~650 m2 roof area) and 89% (~204 m2 roof area), respectively (STEP, 2019)[32].

As referenced above, a stormwater retrofit project that took place at Calstone Inc., located in Scarborough ON., was designed to capture roof runoff, and then directing it toward enhanced green space, irrigating landscaped areas, and infiltrating stormwater onsite. This system diverts water from the municipal storm sewer, strengthening watershed resilience to climate change. With aging stormwater infrastructure in the area that no longer meets current standards, this project serves as a showcase for lot-level LID retrofits (STEP, 2019)[32].
Tailoring LID features to climate change[edit]
Canadian cities typically experience three types of rainfall (City of Vancouver, 2025)[33]:
- light showers
- rainstorms
- extreme storms
Most precipitation events fall into the first category. However, climate change is intensifying storm severity, shifting more events into the second and third categories. One study reported increases in the intensity of 20- and 50-year return period winter precipitation events across the western United States. Another study projected rising intensity of annual maximum precipitation in Canada, with the greatest increases expected in Ontario, the Prairies, and Southern Quebec (Guinard et al., 2015)[34]. As these storm events grow more frequent and intense, much of our infrastructure faces conditions it was never designed to withstand (Government of Ontario, 2012)[35]. To remain effective, the design of LID features must account for these changing precipitation patterns. Go to Understanding rainfall statistics to learn more about rain event distributions.

During Hurricane Hazel (a devastating event in 1954 where 81 lives were lost), the two-hour maximum precipitation was 91 mm and the total amount of rainfall was 285 mm over nearly two days (Toronto Star, 2013)[36]. Conventional municipal drainage systems could not carry stormwater away fast enough; roads and highways were overcome with floodwater closing major transportation corridors, GO Train passengers were stranded, and power outages and basement flooding were widespread with property damage of more than $1 billion (Upadhyaya et al., 2014). Hurricane Hazel served as a catalyst for change, revealing the urgent need for an overhaul of flood management practices (TRCA, 2024)[37]. Hurricane Hazel was larger than the 100-year design storm (Institute for Catastrophic Loss Reduction, 2000)[38].
Intensity-Duration-Frequency Curves[edit]


Intensity–Duration–Frequency (IDF) curves are a standard tool in hydrology that describe the statistical relationship between rainfall intensity, storm duration, and frequency of occurrence (return period) to determine the likelihood of extreme rainfall events (Martel et al., 2021)[41].
- Intensity: the rate of rainfall (mm/hr)
- Duration: the length of the rainfall event (minutes to days)
- Frequency: how often a given storm is expected to occur (e.g., a 10-year storm has a 10% chance of occurring in any given year)
IDF curves are developed from long-term rainfall records and models and are widely used to estimate design storms for stormwater management. IDF curves are crucial for sizing LID BMPs because they:
- Define design storms: LIDs must be able to manage runoff from specific return-period events (e.g., 2-year or 10-year storms). IDF curves provide the rainfall intensity and depth to use for those design events.
- Determine runoff volumes: By applying rainfall depth (from IDF data) to a given catchment, the stormwater volume that LIDs need to capture, infiltrate, or detain can be estimated (USDA, 2021)[42].
- Assess peak flows: LID facilities are often designed to reduce peak discharge. IDF curves help simulate storm hydrographs and assess how much peak flow reduction is required (City of Toronto, 2006) [43].
- Account for climate change: Historical data is no longer an accurate predictor of future extreme rainfall (CSA, 2025)[44]. Since IDF curves are based on historical data, climate change-scaled IDFs can be used to design LIDs that are resilient under future rainfall conditions (ECCC, 2025)[40].
Estimating future rainfall[edit]
When designing infrastructure with a service life longer than 10 years, future IDF curves must account for climate change impacts on the frequency and intensity of extreme rainfall. Future precipitation patterns are estimated to account for climate change impacts.
The atmosphere’s capacity to hold moisture, and thus the occurrence of extreme rainfall, increases with warming. The relationship between increases in rainfall extremes and temperature is called rainfall–temperature scaling. Future rainfall intensities can be estimated via rainfall-temperature scaling using the following equation (CSA, 2025)[44]:

Where
- : the median estimate of the projected future rainfall intensity of duration D and return period RT
- : historical rainfall intensity, obtained from IDF data produced by Environment and Climate Change Canada using stations that are representative of the project site location and have at least 10 years of complete and validated observations. Refer to CSA 231:25 for details on calculating from alternative sources of rainfall observations, if required.
- : the rainfall-temperature scaling factor (typically 1.07 unless otherwise justified)
- : the projected change in local temperature (°C) between the reference and future time periods. Read Chapter 5 of CSA 231:25 Developing and interpreting intensity-duration-frequency (IDF) information under a changing climate for more details on calculating .


External Sources on Climate Change & IDF Curves[edit]
To read about IDF curves and best practices, learn how to integrate climate change into IDF curves, and download climate change-scaled IDF data, visit:
- https://climatedata.ca/interactive/idf-curves-101/
- https://climatedata.ca/resource/idf-data-and-climate-change/
- https://climatedata.ca/resource/best-practices-for-using-idf-curves/
- https://www.csagroup.org/store/product/2705526/?srsltid=AfmBOooZzvRihuxPEkbonAPD3jtG2dFxd5Y-lAFFop5O8Yq4e9ZQggd8
- https://www.idf-cc-uwo.ca/whatsnew
- https://www2.gov.bc.ca/assets/gov/farming-natural-resources-and-industry/natural-resource-use/resource-roads/climate-change-adaptation/pcic_fpi_talk_031022_v4.pdf
- https://www.icwmm.org/files/2025-C034-24.pdf
- https://sourcetostream.com/app/uploads/2016/07/9-F-2-Tonto-Fausto-State-of-Climate-Science-and-Practice-in-ON.pdf
Climate risk and uncertainty[edit]
Risk[edit]
Risk is typically defined as a combination of the likelihood of failure and the consequences of that failure. More detailed frameworks also consider hazard (what could trigger damage), exposure (what is at stake), vulnerability (sensitivity to hazards), and resulting consequences. In the context of climate change, risk is often expressed as (CSA, 2024)[46]:
Risk = (Probability of Climate Event) × (Probability of Asset Failure Given Event) × (Consequences: a function of exposure and vulnerability)
Not all risks can be fully managed; therefore, management efforts are typically prioritized toward impacts that exceed established thresholds of severity and frequency (MECP, 2022).
Uncertainty[edit]

Climate change is inherently characterized by uncertainty, particularly in projecting local impacts. This uncertainty poses challenges for engineers, making risk management a critical tool for prioritizing vulnerabilities and selecting effective risk reduction strategies. Uncertainty surrounding climate impacts underscores the need to build resilience through LID practices (MECP, 2022). The ”no regrets” strategy refers to actions, such as LID, that have positive benefits for people and the environment, regardless of how climate change unfolds.
Planning for climate change in LID design[edit]
Building climate change resiliency into a project is not a reactive process and should be undertaken during early project phase. Climate planning should first identify system vulnerabilities across a wide range of possible future climates, then evaluate the probability and severity of impacts, and finally design adaptation strategies for impacts that exceed the threshold level of risk. A four-step process can be applied to guide resilient LID design (MECP, 2022)[45]:
- Identifying climate change considerations
- Evaluating risk caused by climate change parameters
- Climate change impact management planning
- Monitoring and adaptive management
To learn more about each step and access climate assessment templates, Please select the clickable button below and read Chapter 6 of the Draft LID Stormwater Management Guidance Manual, written by MECP in 2022[45].
![]()
