Difference between revisions of "Bioretention: Life Cycle Costs"
Dean Young (talk | contribs) |
|||
| (4 intermediate revisions by 2 users not shown) | |||
| Line 80: | Line 80: | ||
==Cost Summary Tables== | ==Cost Summary Tables== | ||
| − | Total life cycle cost estimates for the three [[Bioretention]] configurations vary substantially with the [[Bioretention: Partial infiltration| Partial Infiltration]] design being highest ($ | + | Total life cycle cost estimates over the 50 year evaluation period for the three [[Bioretention]] configurations vary substantially with the [[Bioretention: Partial infiltration| Partial Infiltration]] design being highest ($190,132.53), followed closely by [[Stormwater planter| No Infiltration]] design ($185,304.84), and [[Bioretention: Full infiltration| Full Infiltration]] design being the lowest ($153,805.69).<br> |
It is notable that a sensitivity analysis was conducted in 2019 to compare construction cost estimates generated by the tool to actual costs of implemented projects. '''The analysis found that tool estimates were typically within ±14% of actual construction costs'''<ref>Credit Vally Conservation (CVC). 2019. Life-cycle costing tool 2019 update: sensitivity analysis. Credit Valley Conservation, Mississauga, Ontario. https://sustainabletechnologies.ca/app/uploads/2020/04/LCCT-Sensitivity-Analysis_March2020.pdf</ref> | It is notable that a sensitivity analysis was conducted in 2019 to compare construction cost estimates generated by the tool to actual costs of implemented projects. '''The analysis found that tool estimates were typically within ±14% of actual construction costs'''<ref>Credit Vally Conservation (CVC). 2019. Life-cycle costing tool 2019 update: sensitivity analysis. Credit Valley Conservation, Mississauga, Ontario. https://sustainabletechnologies.ca/app/uploads/2020/04/LCCT-Sensitivity-Analysis_March2020.pdf</ref> | ||
| Line 87: | Line 87: | ||
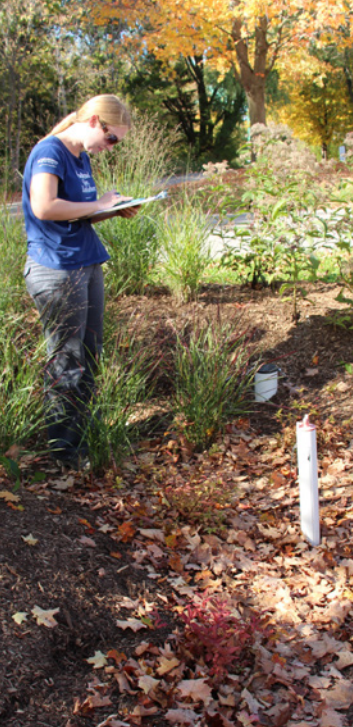
[[File:Picture for page.PNG|thumb|700px|STEP staff member conducting performance analysis of a bioretention feature at Kortright Centre in Vaughan, ON. (Source: STEP, 2016<ref>Performance Comparison of Surface and Underground Stormwater Infiltration Practices - TECHNICAL BRIEF. Low Impact Development Series. https://sustainabletechnologies.ca/app/uploads/2016/08/BioVSTrench_TechBrief__July2015.pdf</ref>)]] | [[File:Picture for page.PNG|thumb|700px|STEP staff member conducting performance analysis of a bioretention feature at Kortright Centre in Vaughan, ON. (Source: STEP, 2016<ref>Performance Comparison of Surface and Underground Stormwater Infiltration Practices - TECHNICAL BRIEF. Low Impact Development Series. https://sustainabletechnologies.ca/app/uploads/2016/08/BioVSTrench_TechBrief__July2015.pdf</ref>)]] | ||
| − | [[File:Design Table Bio Full Infil Update.PNG|700px]]<br> | + | [[File:Design Table Bio Full Infil Update 2023.PNG|700px]]<br> |
</br> | </br> | ||
===Partial Infiltration=== | ===Partial Infiltration=== | ||
| − | [[File:Design Table Bio Partial Infil update.PNG|700px]]<br> | + | [[File:Design Table Bio Partial Infil update 2023.PNG|700px]]<br> |
</br> | </br> | ||
===No Infiltration (Filtration Only)=== | ===No Infiltration (Filtration Only)=== | ||
| − | [[File:Design Table Bio No Infil Update.PNG|700px]]<br> | + | [[File:Design Table Bio No Infil Update 2023.PNG|700px]]<br> |
==References== | ==References== | ||
Latest revision as of 17:17, 16 January 2023
Overview[edit]
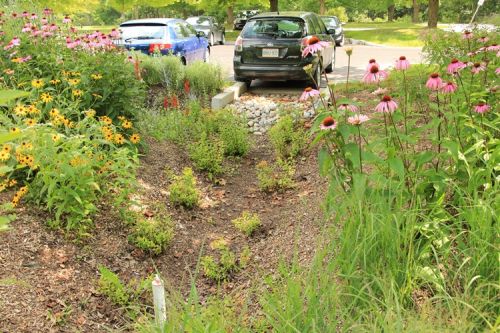
Given that Bioretention is a widely used name and a general "catch-all" term for most vegetated LID practices that temporarily store stormwater runoff in depressed planting beds there are a number of configurations of the feature that can be used in various contexts and environments. Depending on native soil infiltration rate and physical constraints, the facility may be designed without an underdrain for full infiltration, with an underdrain for partial infiltration, or with an impermeable liner and underdrain for no infiltration/filtration only (i.e., a stormwater planters or biofilter) design. Optional components include a flow restrictor to control the release rate of the facility, and surface drains to safely convey flows in excess of the storage capacity of the design. STEP has prepared life cycle costs estimates for each design configuration, based on a 2,000 m2 asphalt drainage area, runoff control target of 25 mm depth and 72 hour drainage period, for comparison which can be viewed below. To generate your own life cycle cost estimates customized to the development context, design criteria, and constraints applicable to your site, access the updated LID Life Cycle Costing Tool (LCCT) here.
Design Assumptions[edit]
Bioretention is an ideal technology for fitting functional vegetation into urban landscapes and treating runoff collected from nearby impervious surfaces.
Components include: a 'filter bed' with filter media, storage layer of reservoir aggregate, planting and a finishing surface layer of mulch and/or stone.
Additional components include an underdrain to remove excess water and soil additives to enhance pollutant removal.
Design and operation and maintenance program assumptions used to generate cost estimates are based on tool default values and the following STEP recommendations:
- Native soil infiltration rates for Full, Partial and No Infiltration Design scenarios were assumed to be 20 mm/h, 10 mm/h and 2 mm/h, respectively, and a safety factor of 2.5 was applied to calculate the design infiltration rate.
- Operation and maintenance (O&M) cost estimates assume annual inspections, removal of trash and debris twice a year, removal of sediment from pretreatment structures annually, and removal of weeds twice a year (where applicable). Verification inspections are included every 5 years to confirm adequate maintenance, and every 15 years to confirm adequate drainage performance through in-situ surface infiltration rate testing.
- Maximum impervious drainage area to permeable surface area (I:P area) ratio of 20:1.
- Length to width ratio of bioretention area is 10:1.
- Default filter media depth of 1.0 metres to accommodate trees in planting plan.
- Default mulch depth of 75 millimetres.
- An underdrain (200 mm diameter perforated pipe) is included in Partial Infiltration and No Infiltration design configurations only.
Notes[edit]
- Designs include pretreatment through stone diaphragms at curb inlets and two inlet structure sumps (Rain Guardian bunkers).
- Operation and maintenance cost estimates assume rehabilitation of the filter media bed surface is required after 25 years of operation.
- The tool calculates costs for new (greenfield) development contexts and includes costs for contractor overhead and profit, material, delivery, labour, equipment (rental, operating and operator costs), hauling and disposal.
- Land value and equipment mobilization and demobilization costs are not included, assuming BMP construction is part of overall development site construction.
- Design and Engineering cost estimates are not calculated by the tool and must be supplied by the user.
- The tool adds 10% contingency and additional overhead as default.
- All cost estimates are in Canadian dollars and represent the net present value (NPV) as the tool takes into account average annual interest and discount rates over the 25 and 50 year operating life cycle periods.
- Unit costs are based on 2018 RSMeans standard union pricing.
- Additional costs associated with retrofit or redevelopment contexts is assumed to be 16% of the cost estimate for new (greenfield) construction contexts.
- Retrofit construction cost estimates are included in the 'Costs Summary' section for comparison.
- Retrofit construction cost estimates are included in the 'Costs Summary' section for comparison.
Construction Costs[edit]
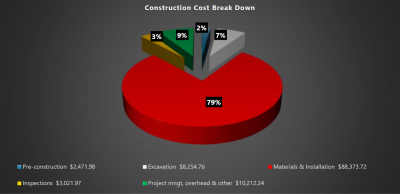
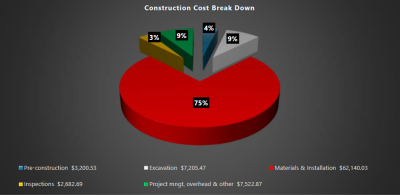
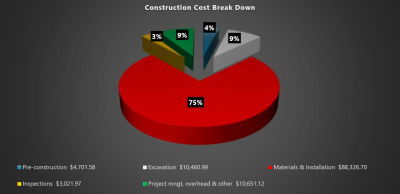
Note: Please click on each image to enlarge to view associated construction cost estimates.
Above you can find breakdowns of construction costs by expense type for 250 m2 surface area facilities (I:P area ratio of 8:1) for each design configuration:
As can be seen, regardless of design configuration, Material & Installation expenses represent the largest portion of total construction costs (75 to 79%).
Life Cycle Costs[edit]
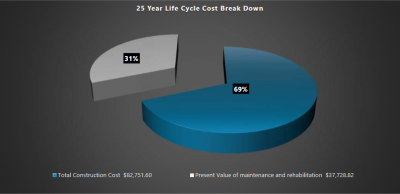
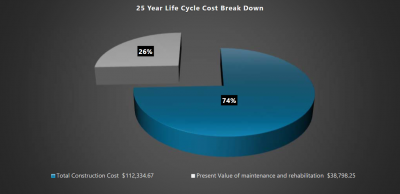
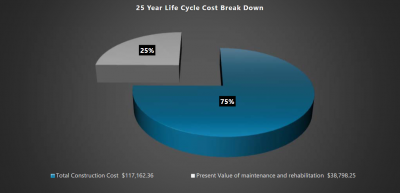
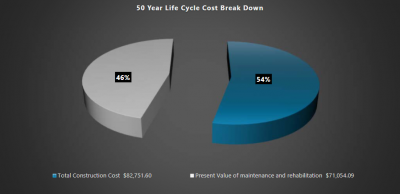
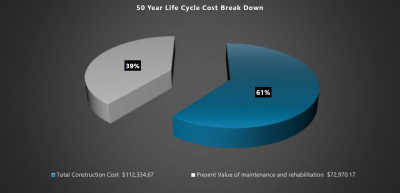
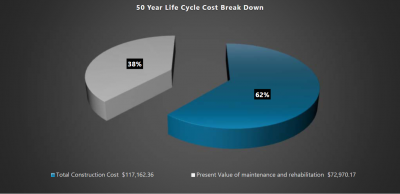
Below are capital and life cycle cost estimates for the three bioretention configurations over 25- and 50-year time periods. The estimates of maintenance and rehabilitation (life cycle) costs represent net present values. Operation and maintenance costs are predicted to represent between 25 and 31% of total life cycle costs over the 25-year evaluation period, and increase to between 38 and 46% of total life cycle costs over the 50-year period, due to filter media bed rehabilitation costs assumed to be required after 25 years of operation.
25-Year life cycle cost break down[edit]
Note: Click on each image to enlarge to view associated life cycle cost estimate.
50-Year life cycle cost break down[edit]
Note: Click on each image to enlarge to view associated life cycle cost estimate.
Cost Summary Tables[edit]
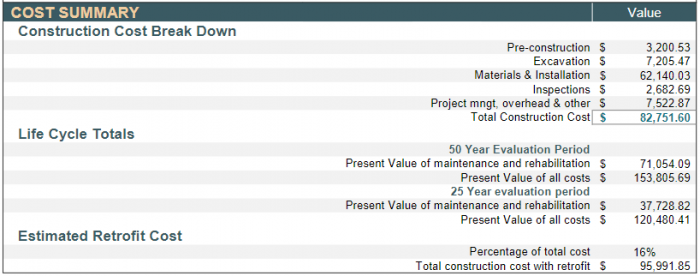
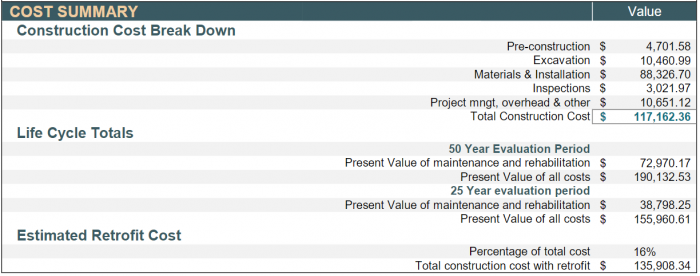
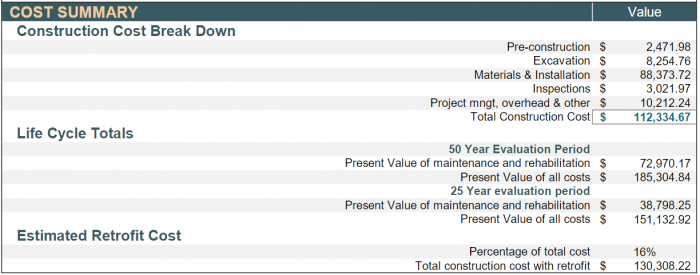
Total life cycle cost estimates over the 50 year evaluation period for the three Bioretention configurations vary substantially with the Partial Infiltration design being highest ($190,132.53), followed closely by No Infiltration design ($185,304.84), and Full Infiltration design being the lowest ($153,805.69).
It is notable that a sensitivity analysis was conducted in 2019 to compare construction cost estimates generated by the tool to actual costs of implemented projects. The analysis found that tool estimates were typically within ±14% of actual construction costs[2]
Full Infiltration[edit]
Partial Infiltration[edit]
No Infiltration (Filtration Only)[edit]
References[edit]
- ↑ Performance Comparison of Surface and Underground Stormwater Infiltration Practices TECHNICAL BRIEF. Accessed Dec 12 2022. https://sustainabletechnologies.ca/app/uploads/2016/08/BioVSTrench_TechBrief__July2015.pdf
- ↑ Credit Vally Conservation (CVC). 2019. Life-cycle costing tool 2019 update: sensitivity analysis. Credit Valley Conservation, Mississauga, Ontario. https://sustainabletechnologies.ca/app/uploads/2020/04/LCCT-Sensitivity-Analysis_March2020.pdf
- ↑ Performance Comparison of Surface and Underground Stormwater Infiltration Practices - TECHNICAL BRIEF. Low Impact Development Series. https://sustainabletechnologies.ca/app/uploads/2016/08/BioVSTrench_TechBrief__July2015.pdf
