Difference between revisions of "Drainage time"
Jenny Hill (talk | contribs) |
|||
| (20 intermediate revisions by 3 users not shown) | |||
| Line 1: | Line 1: | ||
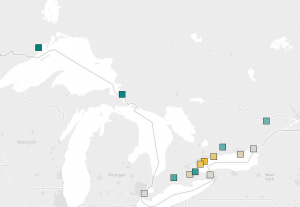
| − | [[File: | + | [[File:Interevent times.PNG|thumb|link=https://public.tableau.com/views/StormIntereventTimesOntario/Dashboard1?:embed=y&:display_count=yes&publish=yes|Darker teal locations have more frequent rainfall; darker yellow have the least frequent rainfall. This image links to a Tableau dashboard, where the interactive data may be viewed in more detail.]] |
| − | |||
| − | |||
| − | |||
| − | [[ | + | |
| − | The analysis was conducted using the recommended minimum inter-event time of 12 hours from the MOECC<ref>Aquafor Beech, EarthFX. Runoff Volume Control Targets for Ontario Final Report. 2016:125. | + | The recommended drawdown times for all storage [[SWM ponds|pond]], [[wetland]], etc.) and [[infiltration]] facilities ([[infiltration trenches|trenches]], [[infiltration chambers|chambers]], [[bioretention]] etc.) are based upon rainfall statistics and the likelihood that the facility will have had time to regenerate storage capacity before the arrival of the next storm event. |
| − | It is not anticipated that recent incremental changes to our climate will have significantly impacted this broad window of recommended | + | |
| − | Locations considered included: | + | A summary analysis of 14 locations across Ontario found that storms were most frequent in Thunder Bay and least frequent in Toronto; there is a ~50% chance of rainfall occurring again within 48 hours (Thunder Bay) to 72 hours (Toronto). |
| + | |||
| + | The analysis was conducted using the recommended minimum inter-event time of 12 hours from the MOECC<ref>Aquafor Beech, EarthFX. Runoff Volume Control Targets for Ontario Final Report. 2016:125. https://municipalclassea.ca/files/7_DRAFT_MOECC_LID%20SWM%20Manual.pdf Accessed September 11, 2017.</ref>, and earlier rainfall probability distribution parameters from 1960's-1980's <ref>Adams, B. J., and Papa, F. (2000). Urban stormwater management planning with analytical probabilistic models. Wiley.</ref>. | ||
| + | It is not anticipated that recent incremental changes to our climate will have significantly impacted this broad window of recommended drainage times*. <br> | ||
| + | </br> | ||
| + | '''Locations considered included:''' | ||
| + | <div style="column-count:3;-moz-column-count:3;-webkit-column-count:3"> | ||
*Brantford | *Brantford | ||
*Etobicoke | *Etobicoke | ||
| Line 22: | Line 25: | ||
*Trenton | *Trenton | ||
*Windsor | *Windsor | ||
| − | < | + | </div> |
| + | |||
| + | |||
| + | '''Note''': It is important to distinguish between [[Drainage time|‘Drawdown time’]] and [[Drainage time|‘Draindown time’]] in LID facilities. '''Drawdown time''' is a concept traditionally used in relation to ponds to refer to the time it takes for the pond to drain water that has been temporarily stored in the facility after a runoff event. Longer drawdown times correspond with lower release rates to streams, which is necessary to control flooding and stream erosion. The Drawdown time in LID facilities is the time it takes for water temporarily stored above the underdrain or overflow pipe to drain down to the invert of the pipe. This time period is often much shorter than the '''48 to 72 hour''' interevent time periods required flood and stream erosion control. | ||
| + | |||
| + | By contrast, '''‘Draindown time’''' is the time required to infiltrate water that has been temporarily stored below the underdrain or overflow pipe. This water will drain down at much slower rates than the water temporarily stored above the [[underdrain]] or overflow. How much of this water needs to drain over the average inter-event period will depend on water balance or runoff volume control targets (not flood or stream erosion control targets). As discussed on this page, on [[Low permeability soils|low permeability soils]] it may be advantageous to maintain a semi permanent reservoir of water below the underdrain or overflow for durations much longer than the interevent period to promote faster infiltration, while still meeting water balance requirements. | ||
| + | |||
| + | ==Calculating infiltration practice drainage time== | ||
| + | |||
| + | Try the Darcy drainage time calculator tool for estimating the time required to fully drain the water storage reservoir of the facility assuming either one or three-dimensional drainage: <br> | ||
| + | {{Clickable button|[[Media:Darcy drainage_20200528_locked.xlsx|Download the Darcy drainage time calculator tool]]}} | ||
| + | |||
| + | ==See also== | ||
| + | [[Understanding rainfall statistics]] | ||
| + | |||
| + | ---- | ||
[[Category:Infiltration]] | [[Category:Infiltration]] | ||
[[Category: Background]] | [[Category: Background]] | ||
Latest revision as of 22:08, 21 January 2025
The recommended drawdown times for all storage pond, wetland, etc.) and infiltration facilities (trenches, chambers, bioretention etc.) are based upon rainfall statistics and the likelihood that the facility will have had time to regenerate storage capacity before the arrival of the next storm event.
A summary analysis of 14 locations across Ontario found that storms were most frequent in Thunder Bay and least frequent in Toronto; there is a ~50% chance of rainfall occurring again within 48 hours (Thunder Bay) to 72 hours (Toronto).
The analysis was conducted using the recommended minimum inter-event time of 12 hours from the MOECC[1], and earlier rainfall probability distribution parameters from 1960's-1980's [2].
It is not anticipated that recent incremental changes to our climate will have significantly impacted this broad window of recommended drainage times*.
Locations considered included:
- Brantford
- Etobicoke
- Hamilton
- Kingston
- London
- Niagara Falls
- Oshawa
- Ottawa
- Peterborough
- Sault Ste Marie
- Thunder Bay
- Toronto
- Trenton
- Windsor
Note: It is important to distinguish between ‘Drawdown time’ and ‘Draindown time’ in LID facilities. Drawdown time is a concept traditionally used in relation to ponds to refer to the time it takes for the pond to drain water that has been temporarily stored in the facility after a runoff event. Longer drawdown times correspond with lower release rates to streams, which is necessary to control flooding and stream erosion. The Drawdown time in LID facilities is the time it takes for water temporarily stored above the underdrain or overflow pipe to drain down to the invert of the pipe. This time period is often much shorter than the 48 to 72 hour interevent time periods required flood and stream erosion control.
By contrast, ‘Draindown time’ is the time required to infiltrate water that has been temporarily stored below the underdrain or overflow pipe. This water will drain down at much slower rates than the water temporarily stored above the underdrain or overflow. How much of this water needs to drain over the average inter-event period will depend on water balance or runoff volume control targets (not flood or stream erosion control targets). As discussed on this page, on low permeability soils it may be advantageous to maintain a semi permanent reservoir of water below the underdrain or overflow for durations much longer than the interevent period to promote faster infiltration, while still meeting water balance requirements.
Calculating infiltration practice drainage time[edit]
Try the Darcy drainage time calculator tool for estimating the time required to fully drain the water storage reservoir of the facility assuming either one or three-dimensional drainage:
See also[edit]
Understanding rainfall statistics
- ↑ Aquafor Beech, EarthFX. Runoff Volume Control Targets for Ontario Final Report. 2016:125. https://municipalclassea.ca/files/7_DRAFT_MOECC_LID%20SWM%20Manual.pdf Accessed September 11, 2017.
- ↑ Adams, B. J., and Papa, F. (2000). Urban stormwater management planning with analytical probabilistic models. Wiley.