Difference between revisions of "Permeable pavements: Life Cycle Costs"
Dean Young (talk | contribs) |
Dean Young (talk | contribs) |
||
| Line 82: | Line 82: | ||
==Cost Summary Tables== | ==Cost Summary Tables== | ||
| − | Total life cycle cost estimates for the three permeable pavement configurations vary substantially with the No Infiltration design being highest ($ | + | Total life cycle cost estimates for the three permeable pavement configurations vary substantially with the No Infiltration design being highest ($262,294.27), compared to the Partial Infiltration design ($242,444.90), and followed closely by the Full Infiltration design ($234,854.66). |
It is notable that a sensitivity analysis was conducted in 2019 to compare construction cost estimates generated by the tool to actual costs of implemented projects. '''The analysis found that tool estimates were typically within ±14% of actual construction costs'''<ref>Credit Vally Conservation (CVC). 2019. Life-cycle costing tool 2019 update: sensitivity analysis. Credit Valley Conservation, Mississauga, Ontario. https://sustainabletechnologies.ca/app/uploads/2020/04/LCCT-Sensitivity-Analysis_March2020.pdf</ref>. | It is notable that a sensitivity analysis was conducted in 2019 to compare construction cost estimates generated by the tool to actual costs of implemented projects. '''The analysis found that tool estimates were typically within ±14% of actual construction costs'''<ref>Credit Vally Conservation (CVC). 2019. Life-cycle costing tool 2019 update: sensitivity analysis. Credit Valley Conservation, Mississauga, Ontario. https://sustainabletechnologies.ca/app/uploads/2020/04/LCCT-Sensitivity-Analysis_March2020.pdf</ref>. | ||
Revision as of 15:58, 10 January 2023
Overview[edit]
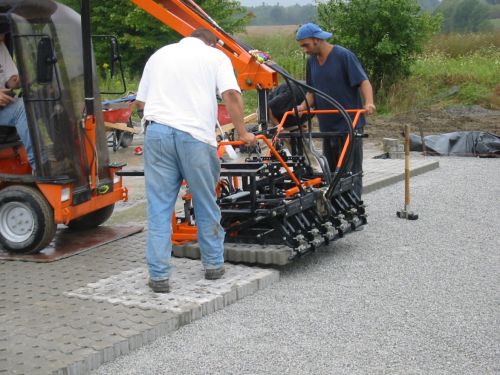
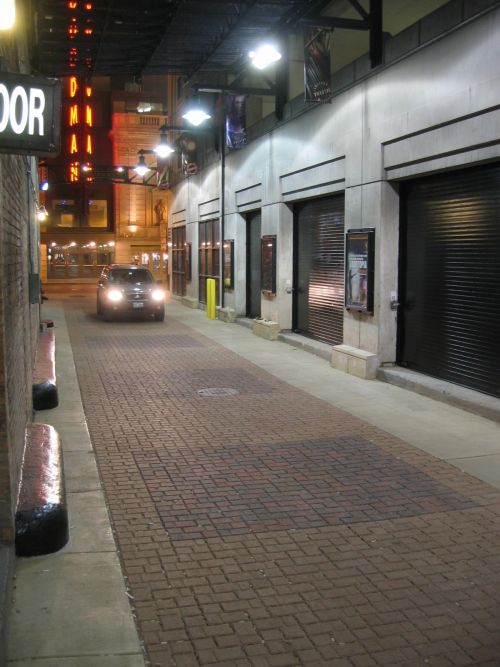
Permeable Pavers are an alternative to traditional impervious pavements that allow stormwater to drain through them and into a storage reservoir aggregate layer below. Depending on the native soil properties and site constraints, the system may be designed for full infiltration, partial infiltration, or as a non-infiltrating detention and filtration only practice. They can be used for low traffic roads, parking, driveways, and walk ways, and are ideal where space for other surface BMPs is limited. Permeable pavement types include:
- permeable interlocking pavers (concrete or composite materials)
- grid systems (concrete or composite materials)
- pervious concrete (poured-in-place or pre-cast)
- porous asphalt
- permeable articulating block/mat systems
The information found here relates to Permeable Interlocking Concrete Pavers (PICP). For costs and information associated with Porous Asphalt click here. STEP has prepared life cycle costs estimates for each design configuration, based on a drainage area composed of 1,000 m2 of conventional asphalt and 1,000 m2 of permeable pavers, runoff control target of 25 mm depth and 72 hour drainage period, for comparison which can be viewed below. To generate your own life cycle cost estimates customized to the development context, design criteria, and constraints applicable to your site, access the updated LID Life Cycle Costing Tool (LCCT) here.
Design Assumptions[edit]
Permeable pavers are ideal for sites with limited space and projects such as low traffic roads, parking lots, driveways and walkways. Components include: interlocking pavers, a bedding aggregate layer, a base aggregate layer, and a sub-base aggregate layer (or stone reservoir) for water storage. Optional components include an underdrain to remove excess water, flow restrictor to control the release rate of the facility, and surface drains to safely convey flows in excess of the storage capacity of the design.
Design and operation and maintenance program assumptions used to generate cost estimates are based on tool default values and the following STEP recommendations:
- Native soil infiltration rates for Full, Partial and No Infiltration Design scenarios were assumed to be 20 mm/h, 10 mm/h and 2 mm/h, respectively, and a safety factor of 2.5 was applied to calculate the design infiltration rate.
- Operation and maintenance (O&M) cost estimates assume annual inspections, removal of trash and debris twice a year, and vacuum sweeping annually. Verification inspections are included every 5 years to confirm adequate maintenance, and every 15 years to confirm adequate drainage performance through in-situ surface infiltration rate testing.
- Impervious drainage area to permeable surface area (I:P area) ratio of 1:1
- Default bedding aggregate (2 to 5 mm dia. clear stone) depth of 50 millimetres.
- Default base aggregate (20 mm dia. clear stone) depth of 100 millimetres.
- Default sub-base aggregate (50 mm dia. clear stone) depth of 200 millimetres.
- A 150 mm diameter perforated underdrain pipe is included in Partial Infiltration and No Infiltration design configurations only.
Notes[edit]
- Operation and maintenance cost estimates include replacement of joint stabilizing aggregate material removed by annual vacuum sweeping and some replacement of damaged pavers, but assume no rehabilitation of the permeable pavement surface is required to maintain acceptable drainage performance over the 50 year timeframe.
- The tool calculates costs for new (greenfield) development contexts and includes costs for contractor overhead and profit, material, delivery, labour, equipment (rental, operating and operator costs), hauling and disposal.
- Land value and equipment mobilization and demobilization costs are not included, assuming BMP construction is part of overall development site construction.
- Design and Engineering cost estimates are not calculated by the tool and must be supplied by the user.
- The tool adds 10% contingency and additional overhead as default.
- All cost estimates are in Canadian dollars and represent the net present value (NPV) as the tool takes into account average annual interest and discount rates over the 25 and 50 year operating life cycle periods.
- Unit costs are based on 2018 RSMeans standard union pricing.
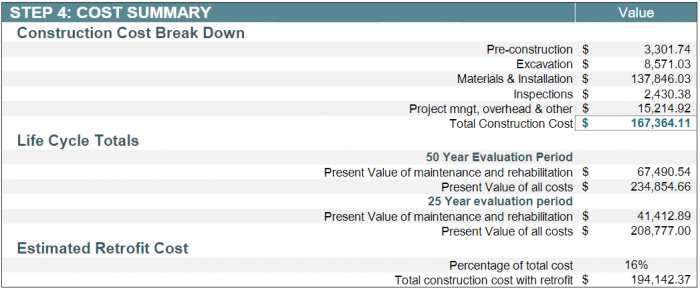
- Additional costs associated with retrofit or redevelopment contents is assumed to be 16% higher than the cost for new (greenfield) development contexts.
- Retrofit construction cost estimates are included in the 'Costs Summary' section for comparison.
- Retrofit construction cost estimates are included in the 'Costs Summary' section for comparison.
Construction Costs[edit]
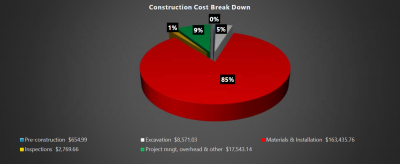
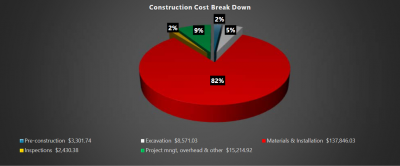
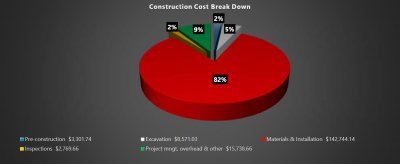
Note: Please click on each image to enlarge to view associated construction cost results.
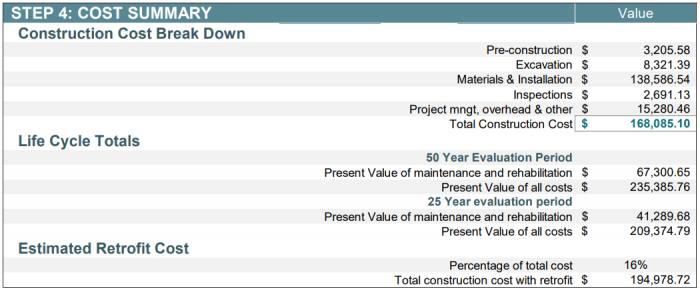
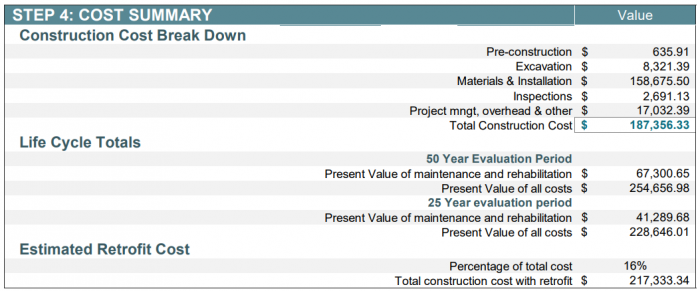
Above you can find breakdowns of construction costs by expense type for a pavement consisting of 1,000 m2 of permeable interlocking concrete pavers and 1,000 m2 of standard asphalt (I:P area ratio of 1:1) for each design configuration:
- Non-infiltrating/filtration only Permeable Pavement,
- Partial infiltration Permeable Pavement
- Full infiltration Permeable Pavement
As can be seen, regardless of outlet configuration, Material & Installation expenses represent the largest portion of the total construction costs (82 to 85%). These include costly components such as the impermeable membrane/liner, underdrain, sub-base layer of 50 mm dia. clear stone, base layer of 19 mm dia. clear stone, bedding layer of 5 mm dia. clear stone and interlocking pavers themselves.
Life Cycle Costs[edit]
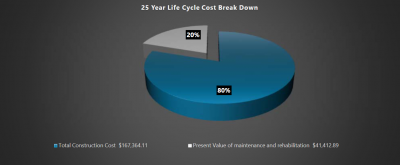
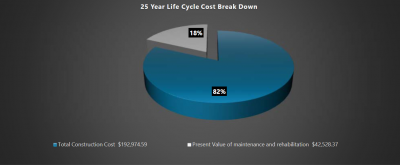
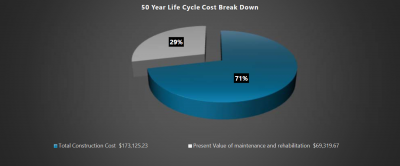
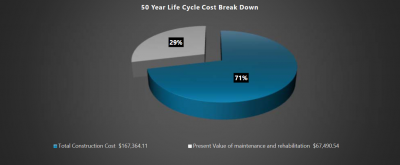
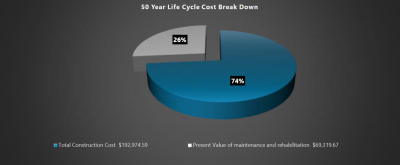
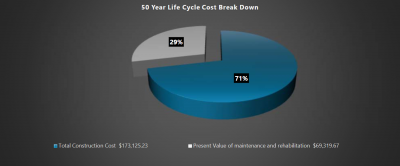
Below are capital and life cycle cost estimates for the three permeable pavement configurations over 25- and 50-year time periods. The estimates of maintenance and rehabilitation (life cycle) costs represent net present values. Operation and maintenance costs are predicted to represent between 18 to 20% of total life cycle costs over the 25-year evaluation period, and increase to between 26 to 29% of total life cycle costs over the 50-year period, due to costs associated with restriping, replacement of limited number of pavers and flushing of underground pipes (underdrain and overflow) after 25 years of operation. Estimates assume no rehabilitation of the permeable pavement surface is required to maintain acceptable drainage performance over the 50 year timeframe.
25-Year life cycle cost break down[edit]
Note: Click on each image to enlarge to view associated life cycle cost results.
50-Year life cycle cost break down[edit]
Note: Click on each image to enlarge to view associated life cycle cost results.
Cost Summary Tables[edit]
Total life cycle cost estimates for the three permeable pavement configurations vary substantially with the No Infiltration design being highest ($262,294.27), compared to the Partial Infiltration design ($242,444.90), and followed closely by the Full Infiltration design ($234,854.66).
It is notable that a sensitivity analysis was conducted in 2019 to compare construction cost estimates generated by the tool to actual costs of implemented projects. The analysis found that tool estimates were typically within ±14% of actual construction costs[1].
Full Infiltration[edit]
Partial Infiltration[edit]
Non-Infiltrating/filtration only[edit]
References[edit]
- ↑ Credit Vally Conservation (CVC). 2019. Life-cycle costing tool 2019 update: sensitivity analysis. Credit Valley Conservation, Mississauga, Ontario. https://sustainabletechnologies.ca/app/uploads/2020/04/LCCT-Sensitivity-Analysis_March2020.pdf
