Difference between revisions of "Intensity-Duration-Frequency Curves"
Jump to navigation
Jump to search
ChristineLN (talk | contribs) (Created page with "===Intensity-Duration-Frequency Curves=== File:Screenshot 2025-08-28 160855.png|400px|thumb|right|Reading IDF Curves: A precipitation event with a duration of 12 minutes, an...") |
ChristineLN (talk | contribs) |
||
| Line 1: | Line 1: | ||
===Intensity-Duration-Frequency Curves=== | ===Intensity-Duration-Frequency Curves=== | ||
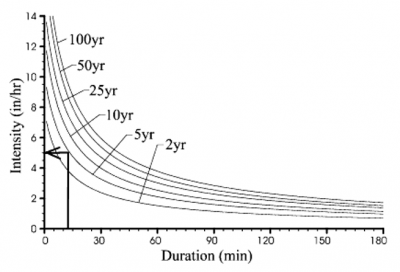
[[File:Screenshot 2025-08-28 160855.png|400px|thumb|right|Reading IDF Curves: A precipitation event with a duration of 12 minutes, and intensity of 5 inches/hour is predicted to occur once every 5 years (Bentley, N.D) <ref>Bentley StormCAD CONNECT Edition Help. N.D. I-D-F Curves.</ref>]] | [[File:Screenshot 2025-08-28 160855.png|400px|thumb|right|Reading IDF Curves: A precipitation event with a duration of 12 minutes, and intensity of 5 inches/hour is predicted to occur once every 5 years (Bentley, N.D) <ref>Bentley StormCAD CONNECT Edition Help. N.D. I-D-F Curves.</ref>]] | ||
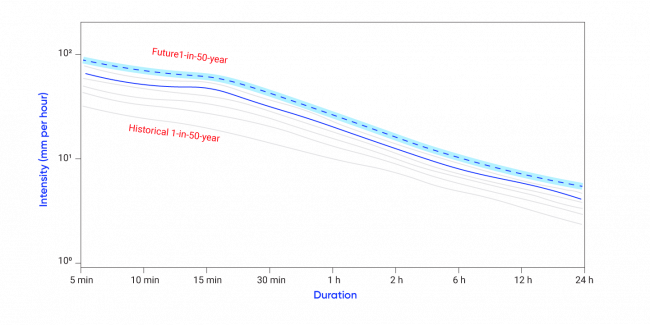
| + | [[File:IDF curve climate change.png|650px|thumb|right|IDF curves may shift under future climate scenarios. In this example, the future 50-year storm is predicted to have a higher rate of rainfall than historical storms of the same return period. LID practices should be designed to accommodate this shift. Image credit: ECCC (2025) <ref name = ECCC>Environment and Climate Change Canada (ECCC). 2025. IDF Data and Climate Change. https://climatedata.ca/resource/idf-data-and-climate-change/</ref>]] | ||
Intensity–Duration–Frequency (IDF) curves are a standard tool in hydrology that describe the statistical relationship between rainfall intensity, storm duration, and frequency of occurrence (return period) to determine the likelihood of extreme rainfall events (Martel et al., 2021)<ref>Martel, J.-L., Brissette, F. P., Lucas-Picher, P., Troin, M., & Arsenault, R. 2021. Climate change and rainfall intensity–duration–frequency curves: Overview of science and guidelines for adaptation. Journal of Hydrologic Engineering, 26(10), 03121001. https://doi.org/10.1061/(ASCE)HE.1943-5584.0002122 </ref>. | Intensity–Duration–Frequency (IDF) curves are a standard tool in hydrology that describe the statistical relationship between rainfall intensity, storm duration, and frequency of occurrence (return period) to determine the likelihood of extreme rainfall events (Martel et al., 2021)<ref>Martel, J.-L., Brissette, F. P., Lucas-Picher, P., Troin, M., & Arsenault, R. 2021. Climate change and rainfall intensity–duration–frequency curves: Overview of science and guidelines for adaptation. Journal of Hydrologic Engineering, 26(10), 03121001. https://doi.org/10.1061/(ASCE)HE.1943-5584.0002122 </ref>. | ||
| Line 12: | Line 13: | ||
# '''Assess peak flows:''' LID facilities are often designed to reduce peak discharge. IDF curves help simulate storm hydrographs and assess how much peak flow reduction is required (City of Toronto, 2006) <ref>City of Toronto. 2006. Wet Weather Flow Management. https://www.toronto.ca/wp-content/uploads/2017/11/9191-wwfm-guidelines-2006-AODA.pdf</ref>. | # '''Assess peak flows:''' LID facilities are often designed to reduce peak discharge. IDF curves help simulate storm hydrographs and assess how much peak flow reduction is required (City of Toronto, 2006) <ref>City of Toronto. 2006. Wet Weather Flow Management. https://www.toronto.ca/wp-content/uploads/2017/11/9191-wwfm-guidelines-2006-AODA.pdf</ref>. | ||
# '''Account for climate change:''' Historical data is no longer an accurate predictor of future extreme rainfall (CSA, 2025)<ref name = CSA2025>CSA, 2025. CSA 231:25 Developing and interpreting intensity-duration-frequency (IDF) information under a changing climate. https://www.csagroup.org/store/product/2431590/?srsltid=AfmBOopkRT3cosyCstZMacCmlthJxgfo6w6aFIXyuEExGmyBT8zw1vMs </ref>. Since IDF curves are based on historical data, climate change-scaled IDFs can be used to design LIDs that are resilient under future rainfall conditions (ECCC, 2025)<ref name = ECCC></ref>. | # '''Account for climate change:''' Historical data is no longer an accurate predictor of future extreme rainfall (CSA, 2025)<ref name = CSA2025>CSA, 2025. CSA 231:25 Developing and interpreting intensity-duration-frequency (IDF) information under a changing climate. https://www.csagroup.org/store/product/2431590/?srsltid=AfmBOopkRT3cosyCstZMacCmlthJxgfo6w6aFIXyuEExGmyBT8zw1vMs </ref>. Since IDF curves are based on historical data, climate change-scaled IDFs can be used to design LIDs that are resilient under future rainfall conditions (ECCC, 2025)<ref name = ECCC></ref>. | ||
| − | |||
| − | |||
| − | |||
Revision as of 17:56, 24 September 2025
Intensity-Duration-Frequency Curves[edit]

Reading IDF Curves: A precipitation event with a duration of 12 minutes, and intensity of 5 inches/hour is predicted to occur once every 5 years (Bentley, N.D) [1]

IDF curves may shift under future climate scenarios. In this example, the future 50-year storm is predicted to have a higher rate of rainfall than historical storms of the same return period. LID practices should be designed to accommodate this shift. Image credit: ECCC (2025) [2]
Intensity–Duration–Frequency (IDF) curves are a standard tool in hydrology that describe the statistical relationship between rainfall intensity, storm duration, and frequency of occurrence (return period) to determine the likelihood of extreme rainfall events (Martel et al., 2021)[3].
- Intensity: the rate of rainfall (mm/hr)
- Duration: the length of the rainfall event (minutes to days)
- Frequency: how often a given storm is expected to occur (e.g., a 10-year storm has a 10% chance of occurring in any given year)
IDF curves are developed from long-term rainfall records and models and are widely used to estimate design storms for stormwater management. IDF curves are crucial for sizing LID BMPs because they:
- Define design storms: LIDs must be able to manage runoff from specific return-period events (e.g., 2-year or 10-year storms). IDF curves provide the rainfall intensity and depth to use for those design events.
- Determine runoff volumes: By applying rainfall depth (from IDF data) to a given catchment, engineers estimate the stormwater volume that LIDs need to capture, infiltrate, or detain (USDA, 2021)[4].
- Assess peak flows: LID facilities are often designed to reduce peak discharge. IDF curves help simulate storm hydrographs and assess how much peak flow reduction is required (City of Toronto, 2006) [5].
- Account for climate change: Historical data is no longer an accurate predictor of future extreme rainfall (CSA, 2025)[6]. Since IDF curves are based on historical data, climate change-scaled IDFs can be used to design LIDs that are resilient under future rainfall conditions (ECCC, 2025)[2].
- ↑ Bentley StormCAD CONNECT Edition Help. N.D. I-D-F Curves.
- ↑ 2.0 2.1 Environment and Climate Change Canada (ECCC). 2025. IDF Data and Climate Change. https://climatedata.ca/resource/idf-data-and-climate-change/
- ↑ Martel, J.-L., Brissette, F. P., Lucas-Picher, P., Troin, M., & Arsenault, R. 2021. Climate change and rainfall intensity–duration–frequency curves: Overview of science and guidelines for adaptation. Journal of Hydrologic Engineering, 26(10), 03121001. https://doi.org/10.1061/(ASCE)HE.1943-5584.0002122
- ↑ USDA. 2021. Estimating Runoff Volume and Peak Discharge. https://directives.nrcs.usda.gov/sites/default/files2/1712930818/31754.pdf
- ↑ City of Toronto. 2006. Wet Weather Flow Management. https://www.toronto.ca/wp-content/uploads/2017/11/9191-wwfm-guidelines-2006-AODA.pdf
- ↑ CSA, 2025. CSA 231:25 Developing and interpreting intensity-duration-frequency (IDF) information under a changing climate. https://www.csagroup.org/store/product/2431590/?srsltid=AfmBOopkRT3cosyCstZMacCmlthJxgfo6w6aFIXyuEExGmyBT8zw1vMs