Difference between revisions of "Testing"
Dean Young (talk | contribs) |
Dean Young (talk | contribs) |
||
| Line 1: | Line 1: | ||
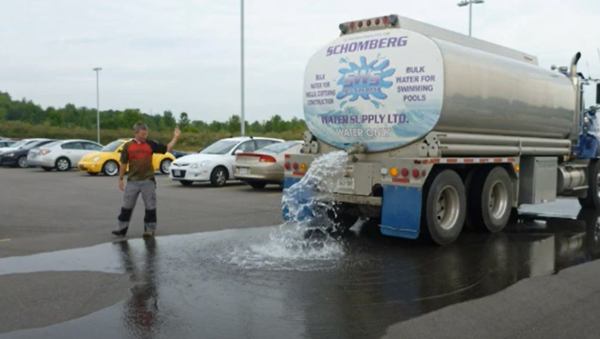
| − | [[File:Water test permeabel pavement.PNG|thumb|600px|A simulated storm event test in an asphalt parking lot to confirm grading and drainage as part of assumption inspection work (STEP, 2019)<ref>STEP. 2019. Permeable Pavement - Inspection and Maintenance Best Practices for Permeable Pavements. Video. Accessed May 11 2022: https://sustainabletechnologies.ca/home/urban-runoff-green-infrastructure/low-impact-development/permeable-pavement/</ref>]] | + | [[File:Water test permeabel pavement.PNG|thumb|600px|A simulated storm event test in an asphalt parking lot to confirm grading and drainage are acceptable as part of assumption inspection work (STEP, 2019)<ref>STEP. 2019. Permeable Pavement - Inspection and Maintenance Best Practices for Permeable Pavements. Video. Accessed May 11 2022: https://sustainabletechnologies.ca/home/urban-runoff-green-infrastructure/low-impact-development/permeable-pavement/</ref>]] |
{{TOClimit|2}} | {{TOClimit|2}} | ||
Revision as of 19:54, 26 October 2022
Soil Characterization Testing[edit]
The soil component of an LID BMP contributes substantially to its stormwater treatment performance and overall function. If the soil is overly compacted or very finely textured, it may drain too slowly. If the soil is highly organic or contains excessive amounts of chemical fertilizer it may contribute to nutrient loads to receiving waters rather than reduce them. If the soil is too shallow it may not provide adequate treatment of contaminated stormwater or may not support healthy vegetation. Whether it be the engineered filter media of bioretention cells, the growing media of green roofs or the topsoil of enhanced swales, vegetated filter strips and soil amendment areas, it is important that the soil provide a healthy growing environment for plantings while being within design specifications for key parameters specific to the type of BMP.
It is most important to sample and test soil characteristics as a part of Construction and Assumption inspections, to confirm the BMP has been constructed with materials that meet design specifications and that installation of the soil component is acceptable. Testing to confirm that the material meets quality specifications (i.e., particle-size distribution, organic matter, pH, cationic exchange capacity, nutrients and soluble salts) needs to be completed prior to it being delivered to the construction site. Testing to confirm that installation of the soil component is acceptable (i.e., depth and compaction) should be performed after the installed material has been allowed to settle for at least two (2) weeks, and prior to planting.
Sampling and testing is also recommended as a part of Verification inspections, to determine if the BMP is being adequately maintained and if soil characteristics are still within acceptable ranges. It may also be done as part of Forensic inspection and Testing (FIT) work to help diagnose the cause of poor vegetation cover, drainage or treatment performance and decide on corrective actions.
LID BMP Type |
Soil Characteristic |
Acceptance Criteriai |
Test |
|---|---|---|---|
| Bioretention / Bioswales / Dry swale | |||
| Textureii | Loamy Sand or Sandy Loam; 70 to 88% sand-sized particles; 12 to 30% silt- and clay-sized particles; <20% clay-sized particles. | Particle-Size Distribution (PSD), or % Sand/Silt/Clay (i.e., Soil Texture) plus Sand Fraction | |
| Organic Matter (OM) | 3 to 10% by dry weightii | Walkley-Black method when OM <7.5% or Loss On Ignition (LOI) method when OM ≥7.5%iii | |
| Soil pH | 6.0 to 7.8 | pH of a Saturated Pasteiii | |
| Cationic Exchange Capacity (CEC) | >10 meq/100 g | Cationic Exchange Capacity Test | |
| Phosphorusiv | 12 to 40 ppm | Extractable Phosphorus | |
| Soluble Saltsv | ≤2.0 mS/cm (0.2 S/m) | Electrical Conductivity of a Soil-Water Slurry (2:1 water to soil ratio by volume)iii | |
| Depth | +/- 10% of design specification | Soil Cores, Test Pits or Cone Penetration Tests | |
| Compactionvi | Surface Resistance: ≤110 PSI; Sub-surface Resistance: ≤260 PSI Bulk Density: ≤1.60 g/cm3 | Cone Penetration Tests or Bulk Density Tests | |
| Permeability | i ≥25 mm/h (KS ≥ 1 x 10⁻⁵ cm/s); and i ≤203 mm/h (KS ≤ 0.02 cm/s). | Surface Infiltration Rate Tests | |
| Enhanced swale (topsoil) | |||
| Texture | Same soil texture classification as specified in the final design or recorded on the as-built drawing | Particle-Size Distribution (PSD), or % Sand/Silt/Clay (i.e., Soil Texture) plus Sand Fraction | |
| Organic Matter (OM)ii | 5 to 10% by dry weight | Walkley-Black method when OM <7.5% or Loss On Ignition (LOI) method when OM ≥7.5%iii | |
| Soil pH | 6.0 to 7.8 | pH of a Saturated Pasteiii | |
| Phosphorusiv | 12 to 40 ppm | Extractable Phosphorus | |
| Soluble Saltsv | ≤2.0 mS/cm (0.2 S/m) | Electrical Conductivity of a Soil-Water Slurry (2:1 water to soil ratio by volume)iii | |
| Depth | +/- 10% of design specification | Soil Cores, Test Pits | |
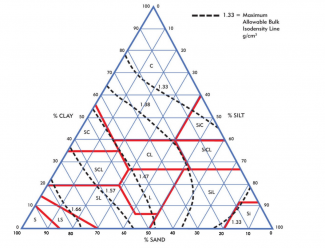
| Compaction | Surface Resistance: ≤110 PSI; Sub-surface Resistance: Use soil texture class and "Soil & Texture Class Table" (below) to determine maximum acceptable value; Bulk Density: Use PSD to interpolate maximum bulk density value from bulk density figure beside this table. | Cone Penetration Tests or Bulk Density Tests | |
| Permeability | i ≥15 mm/h (KS ≥ 1 x 10⁻⁶ cm/s) | Surface Infiltration Rate Tests | |
| Vegetated filter strips and Soil Amendment Areas (topsoil) | |||
| Texture | Same soil texture classification as specified in the final design or recorded on the as-built drawing | Particle-Size Distribution (PSD), or % Sand/Silt/Clay (i.e., Soil Texture) plus Sand Fraction | |
| Organic Matter (OM)ii | 5 to 10% by dry weight | Walkley-Black method when OM <7.5% or Loss On Ignition (LOI) method when OM ≥7.5%iii | |
| Soil pH | 6.0 to 7.8 | pH of a Saturated Pasteiii | |
| Phosphorusiv | 12 to 40 ppm | Extractable Phosphorus | |
| Soluble Saltsv | ≤2.0 mS/cm (0.2 S/m) | Electrical Conductivity of a Soil-Water Slurry (2:1 water to soil ratio by volume)iii | |
| Compaction | Surface Resistance: ≤110 PSI; Sub-surface Resistance: Use soil texture class and "Soil & Texture Class Table" (below) to determine maximum acceptable value; Bulk Density: Use PSD to interpolate maximum bulk density value from bulk density figure beside this table. | Cone Penetration Tests or Bulk Density Tests | |
| Permeability | i ≥15 mm/h (KS ≥ 1 x 10⁻⁶ cm/s) | Surface Infiltration Rate Tests | |
| Green roof (growing media) | |||
| Texture | See product vendor or BMP designer for specifications | Particle-Size Distribution (PSD), or % Sand/Silt/Clay (i.e., Soil Texture) plus Sand Fraction | |
| Maximum Media Density | See product vendor or BMP designer for specification | Maximum Media Density Test (ASTM E2399/E2399M-15) | |
| Water Storage Capacityvii | Extensive: ≥35% by volume / Intensive: ≥45% by volume | Both part of Maximum Media Density Test (ASTM E2399/E2399M-15) | |
| Air-Filled Porosityvii | ≥10% by volume | Part of Maximum Media Density Test (ASTM E2399/E2399M-15) | |
| Permeability, Saturated Media | See product vendor or BMP designer for specification | Part of Maximum Media Density Test (ASTM E2399/E2399M-15) | |
| Organic Matter | See product vendor or BMP designer for specification | Walkley-Black method when OM <7.5% or Loss On Ignition (LOI) method when OM ≥7.5%iii | |
| Soil pHviii | 6.5 to 7.8 | pH of a Saturated Paste | |
| Soluble Saltsviii | ≤0.85 mS/cm (0.085 S/m) | Electrical Conductivity of a Saturated Media Extract (SME)solution | |
| Phosphorusix | 2.2 to 40 ppm | Electrical Conductivity of a Saturated Media Extract (SME)solution |
| Notes |
|---|
| i Values represent acceptable ranges for established BMPs (i.e., in operation for 3 years or more). For Construction and Assumption inspections, final design and soil or media product specifications and permissible tolerance ranges should be used as the acceptance criteria, which may be smaller ranges than the values in this table. |
| ii Suggested range for diagnosing suspected problems with drainage function, vegetation cover or vegetation condition for established BMPs constructed with filter media that meets recommended guidelines (CVC & TRCA, 2010)[3]. For proprietary filter media products, different ranges may be acceptable. Product specifications should be provided by the media supplier. Test results should be compared to the media supplier’s specifications and permissible tolerance ranges |
| iii Based on Ontario Ministry of Food and Rural Affairs’ Soil Fertility Handbook guidance on soil fertility testing for crop production (OMAFRA, 2006)[4]. |
| iv Based on Minnesota Pollution Control Agency (MPCA, 2015)[5] for minimum to sustain plant growth and Ontario Ministry of Agriculture, Food and Rural Affairs (OMAFRA, 2014)[6] for a maximum to avoid unnecessary fertilization that would have low or no effect on plant health. |
| v Based on the threshold for non-saline soils (Whitney, 2011)[7] |
| vi Interpolated value from bulk density figure beside this table. based on a sandy loam soil containing at least 70% sand-sized particles. |
| vii Based on German green roof standards (FLL, 2018)[8]. Specifications will vary depending on the green roof growing media product. Product specifications should be provided by the media supplier. Test results should be compared to the media supplier’s specifications and permissible tolerance ranges. |
| viii Based on Penn State University Center for Green Roof Research (Berghage et al. 2008)[9]. |
| ix Based on Penn State University Center for Green Roof Research (Berghage et al. 2008)[9]. for the minimum to sustain plant growth and Ontario Ministry of Agriculture, Food and Rural Affairs (OMAFRA, 2014) for the maximum to avoid unnecessary fertilization that would have low or no effect on plant health. |
Surface Resistancei |
'Sub-surface Resistancei | ||
|---|---|---|---|
| All Soil Textures | Sandy (includes loamy sand, sandy loam, sandy clay loam and sandy clay) | Silty (includes loam, silty loam, silty clay loam, and silty clay) | Clayey (includes clay loam and clay) |
| ≤ 110 PSIii | ≤ 260 PSI | ≤ 260 PSI | ≤ 225 PSI |
| ≤ 7.7 kg/cm2 | ≤ 18.3 kg/cm2 iii | ≤ 18.3 kg/cm2 | ≤ 15.8 kg/cm2 |
| ≤ 758 kPaiv | ≤ 1793 kPa | ≤ 1793 kPa | ≤ 1551 kPa |
| Notes |
|---|
| i Adapted from Gugino et al. (2009)[10] |
| ii PSI = pounds per square inch (lb/in2) |
| iii kg/cm2 = kilogram per square centimetre. |
| iv kPa = kilopascals |
For further information regarding soil characteristics, acceptance criteria per LID BMP type and associated testing tools and protocols scroll down to the embedded 2016 guide below.
Sediment Accumulation Testing[edit]
A primary function of LID BMPs is to capture and retain sediment, trash and debris that are suspended in stormwater runoff. Over time, sediment and natural debris accumulates in certain portions of a BMP, particularly in pretreatment devices (e.g., forebays, gravel diaphragms, hydrodynamic separators, vegetated filter strips, grass swales, catchbasin/manhole sumps) and at inlets, where inflowing runoff is slowed down and spread out, which promotes sedimentation of suspended materials by design.
Without adequate inspection and maintenance (at least annually), accumulated sediment and debris in pretreatment devices and inlets can inhibit the flow of stormwater into the BMP or be transported onto the filter bed . Extensive sediment accumulation on the surface of a filter bed will eventually lead to drainage problems due to clogging of the filter media with fine-textured sediment. When sediment accumulation on the surface of a filter strip or swales becomes excessive the BMPs begin to export sediment and associated pollutants into receiving waters rather than retain them.
Key Components, Test Methods and Equipment[edit]
Key components of LID BMPs that should be the subject of sediment accumulation testing (i.e., depth measurements) are described in the table below along with recommended test methods. Depth measurements should be recorded on inspection field data forms provided on each associated BMP's I&M page on the wiki, used to determine if sediment removal maintenance is needed.
LID BMP Type |
Key Components |
Recommended Test Method |
|---|---|---|
| Bioretention / Bioswales / Dry swale / Enhanced grass swales / Vegetated filter strips | ||
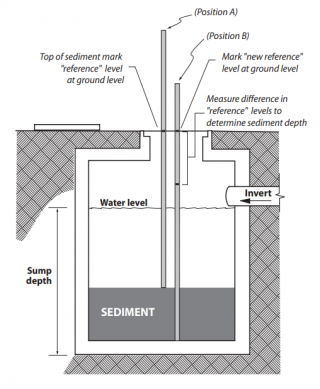
| Inlets; Pretreatment devices | Use a tape measure or probe to measure the depth from the bottom elevation of the pretreatment device or surface of the filter bed (adjacent to the inlet structure), below any stone or mulch cover present, to the highest elevation of accumulated sediment present. For catchbasins, manholes and hydrodynamic separator pretreatment devices a sludge sampler (e.g., “sludge judge” sampler) should be used to sample the sediment and estimate depth accumulated in sumps. Record the measurement and remove the sediment if it exceeds trigger values for follow-up action. | |
| Filter Bed | Use a tape measure or probe to measure sediment depth from the surface of the filter bed, below any stone or mulch cover present, to the elevation of accumulated sediment present in at least five (5) locations evenly distributed over the filter bed surface area. Record the measurements, calculate the mean sediment depth and compare to trigger values to determine if follow-up/corrective actions are needed. | |
| Underground infiltration systems (Soakaways, infiltration trenches, infiltration chambers and perforated pipe storm sewer systems | ||
| Inlets; Pretreatment devices | Use tape measure or probe to measure the depth from the bottom elevation of the inlet pipe or pretreatment device, below any stone or mulch cover present, to the highest elevation of accumulated sediment present. For catchbasins, manholes and hydrodynamic separator pretreatment devices a sludge sampler (e.g., “sludge judge” sampler) should be used to sample the sediment and estimate depth accumulated in sumps. A measuring tape or staff gauge installed in the structure and set to the bottom elevation can provide another means of tracking sediment accumulation. Record the measurement and remove the sediment if it exceeds trigger values. | |
| Filter Bed | (Applicable to vault-type infiltration chamber systems only) - Use a tape measure or probe to measure sediment depth from the surface of the gravel bed to the elevation of accumulated sediment in at least five (5) locations evenly distributed over the bed surface area. Record the measurements, calculate the mean sediment depth and compare to trigger values to determine if follow-up/corrective actions are needed. | |
| Cisterns (Rainwater Harvesting & Rain barrels) | ||
| Cistern | From outside the cistern use a tape measure or probe to measure the depth from a fixed point (e.g., rim of the access hatch) to the bottom elevation of the cistern and to the highest elevation of accumulated sediment present. Subtract the two values to calculate the sediment depth. A sludge sampler (e.g., “sludge judge” sampler) may also be used to sample the sediment and estimate depth. A staff gauge installed on the cistern wall and set to the bottom elevation provides another means of measuring sediment depth that does not require entry into the confined space. Record the measurement and remove the sediment if it exceeds trigger values for follow-up action. |
Standard Equipment Used[edit]
Equipment needed for sediment accumulation testing can include the following:
- Safety apparel (hard hat, steel toed boots, gloves and eye protection)
- Safety cones or barriers (for restricting access around open hatches/grates/manhole covers)
- Clipboard, inspection field data forms, pens
- Pick shovel (for opening catchbasin grates or manhole covers)
- Measuring tape
- Probe (rigid)
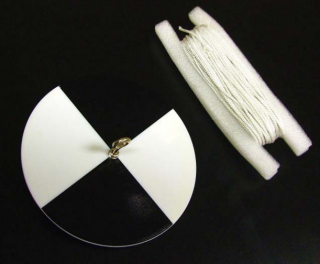
- Secchi disk
- Sludge sampler
- Rope
- Flashlight or headlamp
- Harness
- Tripod (certified and tested)
- Winch (certified and tested)
- Multi-gas detector (recently calibrated and tested)
Sediment accumulation testing should be conducted frequently during construction (e.g., weekly and after any storm event of 15 mm depth or greater), as part of Assumption inspection work, once construction is fully completed and sediment accumulated on the CDA, in conveyances (e.g., gutters, catchbasins, storm sewers) and pretreatment devices has been removed, and as part of Routine Operation and Verification inspections.
For further information regarding soil characteristics, acceptance criteria per LID BMP type and associated testing tools and protocols scroll down to the embedded 2016 guide below.
Surface Infiltration Rate Testing[edit]
For LID BMPs like bioretention and bioswales, enhanced swales, vegetated filter strips and permeable pavements, the rate at which stormwater infiltrates through the BMP surface greatly affects its drainage performance. If the surface infiltration rate (i) is too low, inflowing stormwater will quickly begin to pond on the surface and, once the overflow outlet elevation is reached, will by-pass treatment by the BMP. In extreme cases the BMP may pond water on the surface for longer than 24 hours, creating nuisance conditions (e.g., poor vegetation cover, ice formation, ideal mosquito breeding ground habitat).
Causes of excessively low surface infiltration rates include use of soil during construction that does not meet design specifications, accumulation of fine sediment on the soil surface or in permeable pavement joints or pore spaces, and over-compaction of the soil, that can occur during construction or routine operation. Therefore it is important to test the surface infiltration rate of LID BMPs as part of Assumption and Verification inspections. As part of Assumption inspections it helps determine if the BMP is ready to be assumed by the property owner. As part of Verification inspections it provides an indication of whether or not the surface drainage performance of the BMP is still within an acceptable range, if it is being adequately maintained, and to diagnose the cause of any problems with drainage or vegetation detected through visual inspection or other types of testing. Tests may also be done as part of Forensic Inspection and Testing (FIT) work to diagnose the cause of problems with drainage or vegetation, with the number and locations of test determined by the nature of the problem being investigated.
Surface infiltration rate testing involves estimating the saturated hydraulic conductivity (KS) of the BMP surface through measurement at several locations and calculation of an average value. A single measurement can take anywhere from 15 minutes to several hours (Erickson et al., 2013[13]) depending on soil or surface characteristics.
Filter Bed Surface Infiltration Rate[edit]
To evaluate surface infiltration rate using a surface ponding well during a simulated storm event, the filter media bed should be thoroughly wetted prior to the test. Measurements of filter bed drainage rate and corresponding estimates of surface infiltration rate should be made following natural or simulated storm events that deliver enough water to the BMP to pond at least 75 mm of water on the surface of the filter media bed, in an effort to consistently approximate saturated soil flow conditions.
Calculation[edit]
Filter Bed Surface Infiltration Rate: = 50 / ΔT50
Where
ΔT50 = Time to drain last 50 mm of surface ponded water
ΔT50 = (T2 – T1) x 24
T1 = Post-storm date and time (mm/dd/yyyy hh:mm:ss) when surface ponding water level reaches 50 mm in depth.
T2 = Post-storm date and time (mm/dd/yyyy hh:mm:ss) when surface ponding is fully drained
BMP Components and Test Methods[edit]
Key components of LID BMPs that should be the subject of surface infiltration rate testing are described in the table below along with recommended test methods.
LID BMP Type |
Key Components |
Recommended Test Method |
|---|---|---|
| Bioretention / Bioswales / Dry swale / Enhanced grass swales / Vegetated filter strips | ||
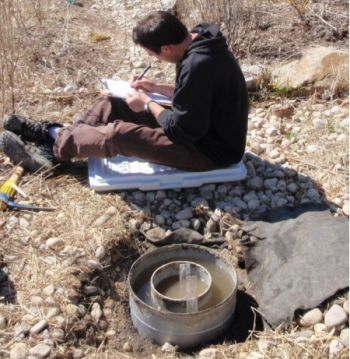
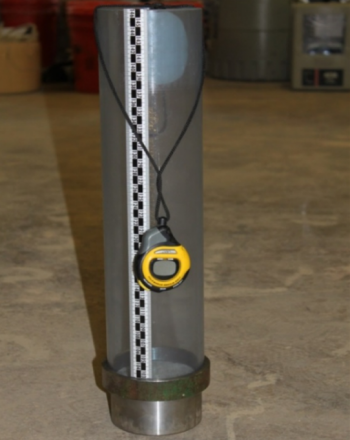
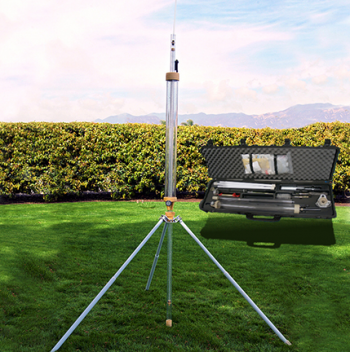
| Filter bed surface | Use an infiltrometer or permeameter to measure field saturated hydraulic conductivity (KS) in at least 5 locations or at a rate of one measurement for every 25 m2 of filter bed surface area, including inlet and lowest elevation areas. Compare mean and individual values to the design specification or trigger value (See Triggers for follow-up and corrective actions below) to determine if follow-up tasks are needed. | |
| Permeable pavement | ||
| Pavement surface | Use a single-ring infiltrometer to measure field saturated hydraulic conductivity (KS) in at least 5 locations or at a rate of one measurement for every 250 m2 of pavement surface area, evenly distributed. For permeable interlocking pavers, follow the procedure provided by ASTM C1781_C1781M – 15 (ASTM International, 2015[14]). For pervious concrete or porous asphalt, follow the procedure provided by ASTM C1701_C1701M – 09 (ASTM International, 2009[15]). Compare mean and individual values to the design specification or trigger value (See Triggers for follow-up and corrective actions below) to determine if follow-up tasks are needed. |
Common Methods for Surface Infiltration Rate Testing[edit]
Method |
Description |
Photo Example |
|---|---|---|
| Double Ring Infiltrometer (constant head) |
|
|
| Single Ring Infiltrometer (constant or falling head) |
|

|
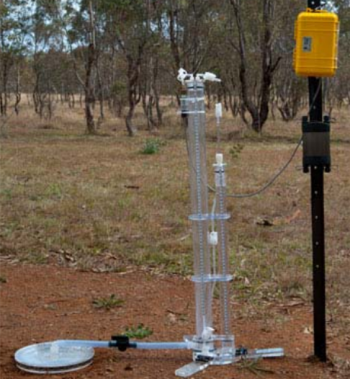
| Modified Philip Dunne Infiltrometer (falling head) |
|
|
| Guelph Permeameter with Tension Disk (constant head) |
|
|
| Tension Infiltrometer (constant or falling head) |
|
|
Standard Equipment Used[edit]
Equipment needed for surface infiltration rate testing will vary depending on the chosen test method (constant head and falling head methods) but can include the following:
- Safety apparel (steel toed boots)
- Safety cones or barriers (for restricting access when testing permeable pavements)
- Clipboard, inspection field data forms, pens
- Testing instrument (e.g., infiltrometer or permeameter) and instruction manual
- Stopwatch
- Water reservoir (e.g., truck mounted tank or cistern filled with water)
- Buckets or jugs (for filling the instrument)
- Plastic graduated cylinder (for measuring volume of water added during constant head infiltrometer tests)
- Soil moisture probe
- Fine sand (for even contact between Tension infiltrometer and soil surface)
Triggers for Follow-Up and Corrective Actions[edit]
BMP Type |
Trigger | Follow-up and Corrective Actions |
|---|---|---|
| Bioretention / Bioswales / Stormwater Tree Trenches / Stormwater planters and Dry swales (filter media bed surface) |
i < 25 mm/h; |
|
| Permeable pavements (pavement surface) |
i < 250 mm/h |
|
| Enhanced swales (swale surface) | i < 15 mm/h;
KS < 1.5 x 10⁻⁶ cm/s |
|
For further information regarding soil characteristics, acceptance criteria per LID BMP type, associated testing tools and protocols along with corrective actions, scroll down to the embedded 2016 guide below.
Natural or Simulated Storm Event Testing[edit]
For LID BMPs that receive stormwater via conveyances like gutters, concrete inlets and leader pipes from roofs or catchbasins (i.e., bioretention and bioswales, enhanced swales, soakaways, infiltration trenches, exfiltration trenches infiltration chambers and soil cells) it is critically important to confirm that these conveyances have been designed and constructed properly. If the conveyances are obstructed or improperly graded or constructed, the BMP may not receive flows from their CDA or a significant quantity of stormwater may by-pass treatment. This is particularly important for underground BMPs where inlets are not visible from the surface. Therefore, confirming that these types of BMPs actually receive stormwater from their CDA should be a part of Assumption and Verification inspections.
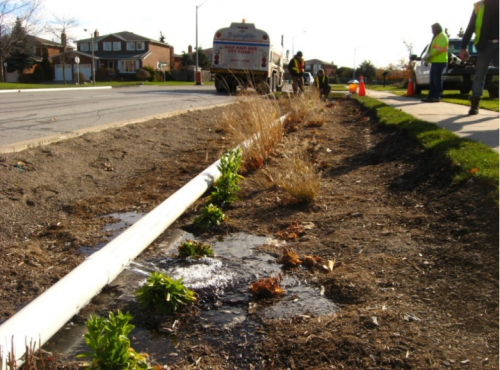
The simplest approach to confirming that conveyances to LID BMPs are constructed properly and functioning well is through observation of the path of water flow and measuring water level in the BMP during a natural storm event. If timelines for completing inspections cannot be coordinated to coincide with a natural storm event, an alternative approach is to simulate a storm event over the CDA by directing water onto it through the use of a water tanker truck or fire hydrant while observing conveyances and measuring water level in the BMP. Such testing not only confirms that conveyances to the BMP are functioning properly but also helps to confirm the size of the CDA (i.e., that site grading is correct) and that sub-drain systems are functioning properly.
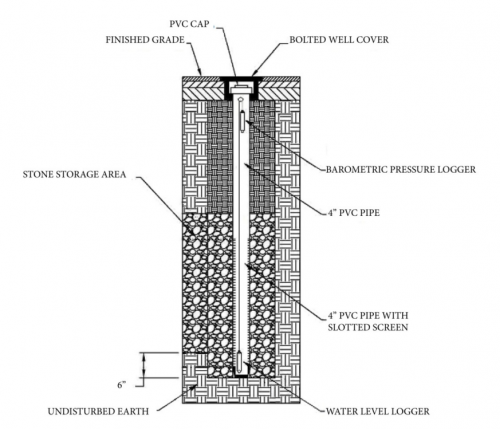
Natural or simulated storm event testing can also be undertaken to confirm that an LID BMP drains at an acceptable rate. Designing such tests is much more involved and requires the deployment of specialized field monitoring equipment like continuous water level loggers (i.e., pressure transducers) in monitoring wells, flow measurement apparatuses (e.g., area-velocity sensors) in sub-drain or outlet pipes and rain gauges, in addition to staff familiar with the use and calibration of such equipment and the processing and analysis of the data. See the "Continuous Monitoring Section" below which provides guidance on the utility and design of continuous monitoring programs along with key references for further reading.
If the primary objective of natural or simulated storm event testing is only to confirm that conveyances are delivering stormwater to the BMP, this is easily done by observing where water flows as it is delivered to the CDA. Prior to and after the release of water, measurements of water level in monitoring wells should be made and recorded to be able to detect whether or not flows are reaching the water storage portion of the BMP if it cannot be observed visually. Manual water levels measurements can be taken by lowering a rod, level tape or string with a weight on the end into the well until the bottom is reached and measuring the height of water present from the maximum water level indicated on the device.
- Water level can also be measured using a pressure transducer installed to just above the bottom of the well and set to continuously record water level at 1 minute intervals. For BMPs that contain sub-drains that can be accessed and visually inspected, observations should be made to determine if flow from the sub-drain pipe occurs following delivery of water to the BMP.
Standard Equipment Used[edit]
Equipment needed for natural or simulated storm event testing will vary depending on the BMP type, objectives of testing and the chosen method but can include the following:
- Water source of sufficient quantity (e.g., water truck, fire hydrant, truck mounted cistern)
- Safety apparel (steel toed boots)
- Safety cones or barriers (for restricting access when testing permeable pavements)
- Clipboard, inspection field data forms, pens
- Camera
- Water level tape or dip stick
- Measuring tape
- Surface ponding well
- Sub-surface water storage reservoir monitoring well
- Pressure transducers data logger (optional ,for detecting water level change in sub-drains)
- Hydrant coupling kit (for connecting to fire hydrant)
- Magnetic flow meter and data logger (for measuring quantity of water delivered to the BMP)
- Pipes (to distribute flow to the CDA or BMP itself)
- Pipe couplings (to connect water truck or fire hydrant hose/nozzle to flow meter and distribution pipes);
- Pick for opening manholes or catch basin grates;
- Multi-gas sensor (for safe access of manholes or catch basins)
Acceptance Criteria[edit]
Acceptance criteria for LID BMP drainage performance for both natural and simulated storm event testing:
- Water flows into the BMP as intended;
- For bioretention, bioswales and enhanced swales, the surface water storage reservoir (i.e., surface ponding) fully drains within 24 hours of the end of the storm;
- For bioretention and bioswales, the filter bed surface infiltration rate ≥25 mm/h and ≤203 mm/h, or consult manufacturer or vendor for an acceptable range specific to the filter media product.
- For enhanced swales, vegetated filter strips and Absorbent landscapes / soil amendment areas, the surface infiltration rate ≥15 mm/h and ≤203 mm/h, or consult manufacturer or vendor for an acceptable range specific to the topsoil product.
- For newly constructed BMPs (i.e., Assumption inspection), the active sub-surface water storage reservoir volume drains within 48 to 72 hours of the end of the storm and sub-drain peak flow rate is within +/- 15% of design specification; and,
- For aged BMPs (i.e., Performance Verification inspections), active sub-surface water storage reservoir volume drains within 48 to 96 hours of the end of the storm and sub-drain peak flow rate is within +/- 15% of design specification.
For further information regarding natural and simulated storm event testing, acceptance criteria per LID BMP type and associated testing tools and protocols scroll down to the embedded 2016 guide below.
Continuous Monitoring[edit]
Continuous monitoring is the most comprehensive approach to inspection of stormwater BMPs that can provide quantitative information about drainage and water treatment performance during actual storm events, which can be directly compared to design specifications and regulatory criteria to determine if it is functioning and performing as intended. Continuous monitoring is the most costly and time-consuming approach to inspection, but warranted in certain situations.
At a minimum, continuous monitoring should be undertaken as part of Assumption and Verification inspections in the following situations:
- For infiltration BMPs designed without sub-drains to determine active sub-surface water storage reservoir volume drainage time and filter bed surface infiltration rate.
- For infiltration BMPs designed with flow-restricted sub-drains, to determine sub-drain peak flow rate, active sub-surface water storage reservoir volume drainage time and filter bed surface infiltration rate.
- As part of Forensic inspection and Testing (FIT) work to determine corrective actions for suspected problems with drainage or effluent quality detected through other inspection and testing work.
- When little information is available about the effectiveness of a certain type of BMP in a certain environmental context, or when a new technology is being implemented for the first time in a certain context or geographic region.
- Where the sensitivity of the receiving water warrants a high level of inspection and testing to determine if BMP effluent quality meets design specifications or regulatory criteria.
External guidance on monitoring the performance of stormwater BMPs[edit]
- Optimizing Stormwater Treatment Practices: A Handbook of Assessment and Maintenance (Erickson et al., 2013)[13];
- Technical Guidance Manual for Evaluating Emerging Stormwater Treatment Technologies (Washington State Department of Ecology, 2018)[35];
- Urban Stormwater BMP Performance Monitoring (Geosyntec Engineers and Wright Water Engineers, 2009)[36];
- Center for Watershed Protection, Managing Stormwater Post-Construction Guide, BMP Performance Verification Tool (Tool 8) Appendix A (CWP, 2008)[37]
- Green Cities, Clean Waters Comprehensive Monitoring Plan, Appendices C and D (City of Philadelphia, 2014)[34]
Drainage Performance Evaluations[edit]
It is recommended that at a minimum, the drainage performance of stormwater infiltration BMPs be evaluated as part of Assumption and Verification inspections. Drainage performance, or the ability of the BMP to fully drain runoff from a certain size storm event within a certain time period, can be evaluated by continuous monitoring during natural or simulated storm events. When a water source of sufficient size to fill the sub-surface water storage reservoir is available, it is recommended that drainage performance evaluations be performed by simulated storm event testing as results can be produced within a much shorter time period (e.g., within a week) as opposed to natural storm event testing, which can require field monitoring activities over 6 months to 2 years in duration.
The general approach involves installing water level logger sensors (i.e., pressure transducers) in:
- a perforated standpipe on the BMP surface to measure the time required to drain water ponded on the surface (i.e., the surface water storage reservoir component) and estimate filter bed surface infiltration rate; and,
- a monitoring well screened within the sub-surface water storage reservoir component of the BMP
Simulated Storm Event Test Procedures[edit]
For infiltration BMPs designed with flow-restricted sub-drains, continuous monitoring to evaluate drainage performance should be performed by conducting a simulated storm event test using the following stepwise procedure below:
- Select a date for the test when no rainfall is forecast for at least 3 days.
- Install flow monitoring apparatus downstream of the sub-drain flow restrictor device.
- Temporarily plug the sub-drain pipe.
- Direct enough water to the BMP to completely fill the sub-surface water storage reservoir.
- Remove the sub-drain plug.
- Allow the BMP to fully drain.
- Determine the maximum flow rate from the sub-drain from flow measurements
- Determine the drainage time from the water level measurements
- Calculate the infiltration rate based on water level measurements once flow from the subdrain has stopped as the change in storage volume over time divided by the infiltration area.
- If more than 13 m3 of water (i.e., the typical capacity of water tanker trucks) is needed to fill the sub-surface water storage reservoir, a fire hydrant will need to be used as the water source.
For infiltration BMPs that contain unrestricted sub-drains, continuous monitoring to evaluate drainage performance should capture the full drainage periods for at least one storm event large enough to completely fill the sub-surface water storage reservoir to the elevation of the sub-drain pipe invert or at least 3 rain events between 15 and 25 mm in depth.
- Mean values for drainage time and infiltration rate should be calculated and compared to design specifications or regulatory criteria to determine if the BMP is draining at an acceptable rate.
- Alternatively, a simulated storm event test can be performed, using the stepwise procedure described above.
Water Treatment Performance Evaluations[edit]
When the objectives of BMP inspection include determining if the BMP is providing a minimum level of water treatment performance, design of the continuous monitoring program needs considerable thought. Table 8.10 describes some key considerations in program design.
Variable |
Key Considerations |
Recommendations |
|---|---|---|
| BMP Water Storage Capacity | Many LID BMPs contain sub-drains that only flow during large storm events which will limit the number of events that produce water samples in a given year. |
|
| Inlet configuration |
Measuring and sampling inflow is often not feasible for BMPs that receive sheet flow or have multiple inlets. |
|
| Flow-Weighted Sampling Method | How individual water samples are combined to produce the composite sample for laboratory testing will greatly affect results. |
|
| Storm Event Size and Duration | To adequately characterize water treatment performance, monitoring results from a range of storm event sizes is needed which requires that the programming of automated water samplers should be capable of capturing flow from a range of storm event depths and durations. |
|
| Water Quality Parameters of Interest | The cost of laboratory testing of water samples increases with the number of parameters to be tested. Water treatment performance evaluations should focus on the parameters of greatest concern from regulatory or receiving water sensitivity perspectives. |
|
| Security of Monitoring Equipment | In some cases, monitoring equipment will need to be installed at the ground surface, and require means of preventing tampering or sabotage. |
|
| Confined Space Entry | Installing and checking flow monitoring and sampling equipment often requires entry into confined spaces. |
|

Accredited Water Testing Laboratories (ON)[edit]
- Accuracy Environmental Laboratories Ltd.
- AGAT Laboratories Ltd.
- ALS Laboratory Group (Env. Division)
- Caduceon Environmental Laboratories
- City of Hamilton Environmental Laboratory
- City of Ottawa Laboratory Services
- Exova Canada Ltd. - Now "element"
- Maxxam Analytics - Now Bureau Veritas
- Ontario Ministry of the Environment Conservation & Parks (MECP)
- Paracel Laboratories
- Regional Municipality of Waterloo, Environmental Laboratory
- Testmark Laboratories Ltd.
- Toronto Water Laboratory
- York-Durham Regional Environmental Laboratory
For further information regarding natural and simulated storm event testing, acceptance criteria per LID BMP type and associated testing tools and protocols scroll down to the embedded 2016 guide below.
Green Roof Irrigation System Testing[edit]
In dry or temperate climates, an irrigation system can be crucial for establishing and maintaining green roofs. Extensive green roofs planted with drought tolerant plants do not always need an irrigation system, but intensive green roofs planted with a wider variety of plants would not be able survive without one. Most green roofs will require supplemental water either to enhance or speed up the establishment process or to protect the plantings during times of sustained drought. This can be accomplished by hand watering or installing an automated irrigation system.
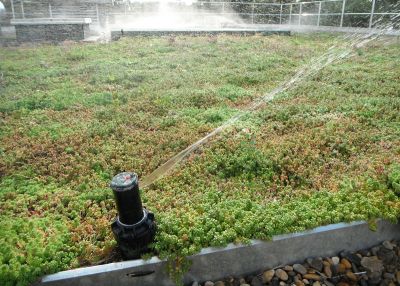
Irrigation systems vary greatly in level of complexity:
- Simply hand watering systems using hose bibs on the roof and manual sprayers;
- Installed automated systems that are activated by timers; or,
- Sophisticated “smart irrigation” systems that can be remotely controlled and coupled with rain sensors or sources of local weather data to only operate during extended dry periods (i.e., droughts).
- Drip irrigation is the most common type of irrigation system for green roofs because it transfers the water directly to the growing medium via drip emitters installed at or near the surface with relatively little loss to evaporation.
- Other types of irrigation systems use handheld or installed spray nozzles to distribute water to the plants. If an automatic irrigation system is in place, individuals performing inspection testing, maintenance and repairs on it should refer to the operator’s manual from the product vendor or installer for instructions specific to that product.
Triggers for Corrective Action[edit]
A green roof irrigation system test involves:
- inspecting the supply lines,
- fittings and
- distribution points (e.g., drip emitters or spray heads)
All while the system is running to check for leaking, damaged, obstructed or misaligned components and dry or saturated portions of the filter bed/growing medium.
Triggers for Action include:
- A leaking or damaged supply line will often wash out or saturate a small area.
- An obstructed drip emitter or spray nozzle will create dry spots.
- If visual assessments of vegetation cover and condition reveal locations where plantings have died or are not thriving, make sure it is not due to irrigation system malfunction or damage.
- If the irrigation system test results in ponding on the filter bed/growing medium surface or in/around overflow outlets, repair or routine maintenance of those components may be necessary.
Green Roof Leak Detection Testing[edit]
On buildings featuring a green roof, a waterproofing membrane layer that covers the whole roof is essential to prevent water damage to the building. In some cases, a root barrier layer is also a part of the green roof design that protects the waterproofing membrane from being penetrated by roots and degraded by soil microbial activity. On top of these protective layers are the water retention and drainage layer, filter cloth, growing media and plants, making it impossible to visually inspect them for damage or leaks. There are two main approaches to leak detection for green roofs – flood tests and low-voltage leak detection tests.
Flood Tests[edit]
Flood tests for detection of green roof leaks can be conducted as part of Construction inspections, prior to planting. The test requires an experienced professional to narrow down a small area where the leak may be originating from. The suspected area is isolated from the rest of the roof, the roof drains are plugged, 10 cm of water depth is introduced and observations are made. Once the leak is found, the area is opened up and the waterproofing membrane is repaired. This process is time-consuming and costly, as the leak is not always found during the first round of patch flooding (US GSA, 2011)[41]
Low-Voltage Leak Tests[edit]
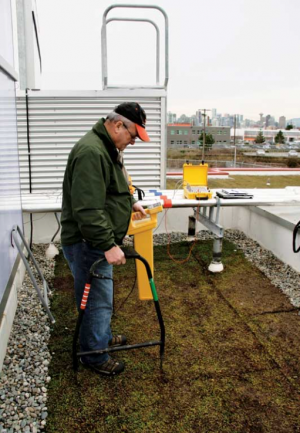
The low-voltage leak detection test utilizes electricity to locate water penetrations through the waterproofing membrane. Such leak detection systems can also be referred to as Electric Field Vector Mapping (EFVM®) systems. They require a grounded, conductive material be directly below the waterproofing membrane, such as reinforced concrete or metal, and that the membrane be a nonconductive material. During roof construction and prior to green roof installation, a conductive wire is looped around the surface of the waterproofing membrane and connected to an impulse generator.
Testing involves the inspector or leak detection technician introducing a low-voltage, pulsating electric charge onto the surface of the waterproofing membrane which should be moist at the time. A watertight membrane will isolate the potential difference between the wetted surface and the underlying grounded conductive material layer, while breaches in the membrane will cause an electrical connection to occur. The inspector or leak detection technician reads the directional flow of current with a potentiometer to locate the point of entry with pinpoint accuracy. Low-voltage leak detection tests can be performed before and after a green roof is installed. As such, the location of leaks can be very precisely located and repaired with minimal disturbance to the rest of the roof (US GSA, 2011)[41].
Testing & Inspection Types[edit]
It is important to test green roofs for leaks as part of Construction, Assumption and Verification inspections.
- As part of Construction inspections, testing confirms that the roof layers have been installed correctly and that it is ready for planting.
- As part of Assumption inspections it helps determine if the green roof is ready to be assumed by the property owner/manager/municipality.
- Tests may also be done as part of Verification inspections (i.e., every five years) to check for leaks, and as part of FIT work to locate and repair leaks discovered through visual inspection work.
Cistern Pump Testing[edit]
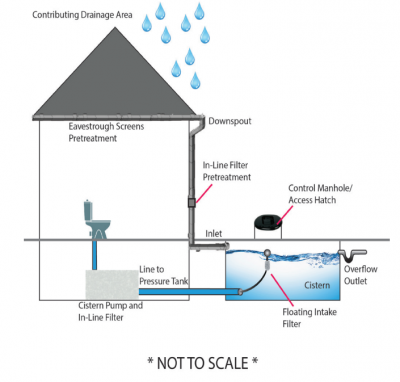
Most rainwater cisterns are placed in basements or outdoors, and require a pump to distribute the water to service its designated locations throughout the property, generally located at higher elevations. Typically, a pump is arranged with a pressure tank, which includes a centrifugal pump that draws the water out of the storage tank and into the pressure tank, where it is stored and ready for distribution. As part of this distribution system, an appropriately sized pump is required to produce a sufficient flow to efficiently transport water that feeds into the pressure tank. With prolonged usage, the pump capacity may decline, which would be reflected by a reduction in flow rate.
Flow Rate testing[edit]
A simple flow rate measurement using a bucket, stopwatch and volume measurement device (e.g., graduated cylinder) at the outlet location can reveal whether the pump is functioning. Once the flow rate is measured the value can be compared to the design flow rate. If the pump is not creating sufficient pressure, then the flow rate will be inadequate. If the flow rate is below the design specification, servicing of the pump by a skilled technician should be scheduled.
Water Quality Testing[edit]
In addition to confirming that the pump is functioning and checking on the flow rate, routinely conducting cistern pump tests also provides the opportunity to visually inspect the water produced by the system. If the water delivered from the cistern is discoloured or highly turbid (i.e., murky), it indicates that the pretreatment device or filtration system is malfunctioning or needs maintenance.
Embedded Reference Guide[edit]
To gain further insight into various testing requirements/methods, acceptance requirements, associated tools, equipment and components from STEP on the inspection and maintenance of different BMP LID practices, please see our complete guide here or embedded below:
References[edit]
- ↑ STEP. 2019. Permeable Pavement - Inspection and Maintenance Best Practices for Permeable Pavements. Video. Accessed May 11 2022: https://sustainabletechnologies.ca/home/urban-runoff-green-infrastructure/low-impact-development/permeable-pavement/
- ↑ Sustainable Sites Initiative. 2009. The Sustainable Sites Initiative: Guidelines and Performance Benchmarks. American Society of Landscape Architects, Lady Bird Johnson Wildflower Center at The University of Texas at Austin, United States Botanic Garden and Sustainable Sites Initiative, Austin, TX. https://digital.library.unt.edu/ark:/67531/metadc31157/
- ↑ CVC and TRCA, 2010. Low Impact Development Stormwater Management Planning and Design Guide. Version 1.0. https://cvc.ca/wp-content/uploads/2014/04/LID-SWM-Guide-v1.0_2010_1_no-appendices.pdf
- ↑ OMAFRA. 2006. Soil Fertility Handbook Publication 611. Guelph, Ontario, Canada. http://www.omafra.gov.on.ca/english/crops/pub611/pub611.pdf.
- ↑ Minnesota Pollution Control Agency (MPCA). 2015. Minnesota Stormwater Manual. Accessed April 15, 2015. http://stormwater.pca.state.mn.us/index.php/Main_Page
- ↑ Ontario Ministry of Agriculture, Food and Rural Affairs (OMAFRA). 2014. Guide to Nursery and Landscape Plant Production and IPM. Publication #841. Toronto, Ontario. http://www.omafra.gov.on.ca/english/crops/pub841/pub841.pdf
- ↑ Whitney, D.A. 2012. “Soil Salinity.” In Recommended Chemical Soil Test Procedures for the North Central Region. North Central Regional Research Publication No. 221. Missouri Agricultural Experimental Station. https://www.canr.msu.edu/uploads/234/68557/rec_chem_soil_test_proce55c.pdf
- ↑ Forschungsgesellschaft Landschaftsentwicklung Landschaftsbau (FLL). 2008. Guidelines for the Planning, Construction and Maintenance of Green Roofs. The Landscaping and Landscape Development Research Society E.V., Bonn, Germany. https://shop.fll.de/de/downloadable/download/sample/sample_id/44/
- ↑ 9.0 9.1 Berghage, R., Wolf. A., Miller, C. 2008. Testing Green Roof Media for Nutrient Content. Presented at Greening Rooftops for Sustainable Communities, held in Baltimore, MD from April 30 to May 2, 2008. http://admin.ipps.org/uploads/58_086.pdf
- ↑ Gugino, B.K., Idowu, O.J., Schindelbeck, R.R., van Es, H.M., Wolfe, D.W., Moebius, B.N., Thies, J.E., and Abawi, G.S. 2009. Cornell Soil Health Assessment Training Manual, Edition 2.0, 2009, Cornell University, College of Agriculture and Life Sciences, New York State Agricultural Experiment Station(NYSAES), Geneva, New York. ISBN 0-9676507-4-7. https://www.canr.msu.edu/foodsystems/uploads/files/cornell_soilhealth.pdf
- ↑ Wildco. 2018. Secchi Disk Kit, Fieldmaster®. Accesses May 5 2022: https://shop.sciencefirst.com/wildco/student-water-samplers/5979-fieldmaster-student-secchi-disk-non-calibrated-line-for-student-use-only-200mm.html
- ↑ King County. 2010. Tips for Successful Drainage Facility Self-Inspection. Department of Natural Resources and Parks. File Name: 0906_DrainTIPS.indd lpre. Developed: June, 2010. https://www.seatacwa.gov/home/showpublisheddocument/31441/637662770980630000
- ↑ 13.0 13.1 Erickson, A.J., Weiss, P.T., Gulliver, J.S. 2013. Optimizing Stormwater Treatment Practices: A Handbook of Assessment and Maintenance. New York: Springer. https://link.springer.com/book/10.1007/978-1-4614-4624-8
- ↑ ASTM International. 2015. ASTM C1781/C1781M-15 - Standard Test Method For Surface Infiltration Rate Of Permeable Unit Pavement Systems. Accessed May 5 2022: https://webstore.ansi.org/Standards/ASTM/astmc1781c1781m15
- ↑ ASTM International. 2009. ASTM C1701/C1701M-09 - Standard Test Method for Infiltration Rate of In Place Pervious Concrete. Accessed May 5 2022: https://www.astm.org/c1701_c1701m-09.html
- ↑ ASTM International. 2005. Sealed Double-Ring Infiltrometers for Estimating Very Low Hydraulic Conductivities. Volume 28, Issue 3. CODEN: GTJODJ. Published Online: 30 March 2005. DOI: 10.1520/GTJ12447. https://www.astm.org/gtj12447.html
- ↑ ASTM International. 2018. Standard Test Method for Infiltration Rate of Soils in Field Using Double-Ring Infiltrometer. Book of Standards Volume: 04.08. Published Online: 11 April, 2018. DOI: 10.1520/D3385-09. https://www.astm.org/d3385-09.html
- ↑ ASTM International. 2018). Standard Test Method for Field Measurement of Infiltration Rate Using Double-Ring Infiltrometer with Sealed-Inner Ring. Book of Standards Volume: 04.08 Published Online: 17 April, 2018. DOI: 10.1520/D5093-15. https://www.astm.org/d5093-15.html
- ↑ 19.0 19.1 ASTM International, 2010. Standard Test Methods for Measurement of Hydraulic Conductivity of Saturated Porous Materials Using a Flexible Wall Permeameter. Book of Standards Volume: 04.08. Published Online: 31 December, 2010. DOI: 10.1520/D5084-03. https://www.astm.org/d5084-03.html
- ↑ Werner, A. 2010. File:Single ring.JPG. Original upload December 21, 2005. Author: Soil Physics at English Wikipedia. https://commons.wikimedia.org/wiki/File:Single_ring.JPG.
- ↑ Klute, A. 1986. Methods of soil analysis, Part I. Physical and mineralogical methods, 2nd edition. Soil Science Society of America. Madison, WI. https://acsess.onlinelibrary.wiley.com/doi/book/10.2136/sssabookser5.1.2ed
- ↑ ASTM International, 2015. Standard Test Method for Surface Infiltration Rate of Permeable Unit Pavement Systems. Book of Standards Volume: 04.05. Published Online: 27 December, 2018. DOI: 10.1520/C1781_C1781M-15. https://www.astm.org/c1781_c1781m-15.html
- ↑ ASTM. 2009. Standard Test Method for Infiltration Rate of In Place Pervious Concrete. Book of Standards Volume: 04.02. Published Online: 17 March, 2017. DOI: 10.1520/C1701_C1701M-09. https://www.astm.org/c1701_c1701m-09.html
- ↑ Ahmed, F., Gulliver, J.S. and Nieber, J.L. 2011. Performance of low impact development practices on stormwater pollutant load abatement. https://www.researchgate.net/publication/283326958_Performance_of_Low_Impact_Development_Practices_on_Stormwater_Pollutant_Load_Abatement
- ↑ Ahmed, F. and Gulliver, J.S. 2011. User’s manual for the MPD infiltrometer. St. Anthony Falls Laboratory, University of Minnesota, Minneapolis, MN. https://conservancy.umn.edu/bitstream/handle/11299/122987/Ahmed-Gulliver-Nieber%20%282011%29%20-%20SAFL%20PR560.pdf?sequence=1&isAllowed=y
- ↑ ASTM International. 2022. Standard Practice for Measuring Field Infiltration Rate and Calculating Field Hydraulic Conductivity Using the Modified Philip Dunne Infiltrometer Test. Book of Standards Volume: 04.09. Published Online: 28 July, 2022. DOI: 10.1520/D8152-18. https://www.astm.org/d8152-18.html
- ↑ Hoskin Scientific Ltd. 2022. Guelph Permeameter Kit. https://www.hoskin.ca/catalog/index.php?main_page=product_info&cPath=1_59_67_3677&products_id=5082
- ↑ Soil Moisture Equipment Corporation. 1986. Guelph permeameter 2800ki operating instructions. Revision 8/86. Santa Barbara, CA.)
- ↑ ICT International. n.d. Determination of Soil Unsaturated Hydraulic Conductivity. https://www.ictinternational.com/casestudies/determination-of-soil-unsaturated-hydraulic-conductivity/
- ↑ Erickson, A.J., Weiss, P.T., Gulliver, J.S. 2013. Optimizing Stormwater Treatment Practices: A Handbook of Assessment and Maintenance. New York: Springer. https://experts.umn.edu/en/publications/optimizing-stormwater-treatment-practices-a-handbook-of-assessmen
- ↑ 31.0 31.1 Reynolds, W.D. and Elrick, D.E. 1991. Determination of hydraulic conductivity using a tension infiltrometer. Soil Science Society of America Journal. 55(3):633-639. to calculate a value for saturated hydraulic conductivity. https://acsess.onlinelibrary.wiley.com/doi/abs/10.2136/sssaj1991.03615995005500030001x
- ↑ Zhang, R. 1997. Determination of soil sorptivity and hydraulic conductivity form the disk infiltrometer. Soil Science Society of America Journal. 61: 1024-1030. https://acsess.onlinelibrary.wiley.com/doi/abs/10.2136/sssaj1997.03615995006100040005x
- ↑ Toronto and Region Conservation Authority (TRCA). 2016. Low Impact Development Stormwater Management Practice Inspection and Maintenance Guide. Prepared by the Sustainable Technologies Evaluation Program. Vaughan, Ontario. https://sustainabletechnologies.ca/app/uploads/2016/08/LID-IM-Guide-2016-1.pdf
- ↑ 34.0 34.1 . City of Philadelphia. 2014. Green City, Clean Waters: Comprehensive Monitoring Plan. The Philadelphia Water Department. Philadephia, PA. http://archive.phillywatersheds.org/ltcpu/GCCW%20Comprehensive%20Monitoring%20Plan%20Sections%201-10.pdf
- ↑ Washington State Department of Ecology (WS DOE). 2018. Technical Guidance Manual for Evaluating Emerging Stormwater Treatment Technologies. Publication No. 11-10-061. Technology Assessment Protocol – Ecology. Water Quality Program. Olympia, WA. https://apps.ecology.wa.gov/publications/documents/1810038.pdf
- ↑ Geosyntec Consultants and Wright Water Engineers. 2009. Urban Stormwater BMP Performance Monitoring. Prepared under Support from U.S. Environmental Protection Agency, Water Environment Research Foundation, Federal Highway Administration, Environmental and Water Resources Institute of the American Society of Civil Engineers. Published October 2009. https://static1.squarespace.com/static/5f8dbde10268ab224c895ad7/t/604926dae8a36b0ee128f8ac/1615406817379/2009MonitoringManualSingleFile.pdf
- ↑ Center for Watershed Protection (CWP). 2008. Managing Stormwater in Your Community – A Guide for Building and Effective Post-Construction Program. U.S. EPA Publication No: 833-R08-001. Ellicott City, MD. EPA Publication No: 833-R-08-001. https://www3.epa.gov/npdes/pubs/stormwaterinthecommunity.pdf
- ↑ City of Markham. n.d. Water Quality and Testing. The Corporation of the City of Markham. Accessed May 10 2022. https://www.markham.ca/wps/portal/home/neighbourhood-services/water-sewer/water-quality-and-testing/04-water-quality-and-testing
- ↑ Vegetal i.D. n.d. Green Roof Irrigation. Accessed May 10 2022: https://www.vegetalid.us/green-roof-technical-resources/extensive-green-roof-design-guide/270-green-roof-irrigation.html
- ↑ Construction Canada. 2012. Waterproofing considerations for green roofs. By Karen Liu, PhD. Kenilworth Media Inc. Accessed May 10 2022: https://www.constructioncanada.net/waterproofing-considerations-for-green-roofs/2/
- ↑ 41.0 41.1 United States General Services Administration (US GSA). 2011. The Benefits and Challenges of Green Roofs on Public and Commercial Buildings. 140 pp. https://www.gsa.gov/cdnstatic/The_Benefits_and_Challenges_of_Green_Roofs_on_Public_and_Commercial_Buildings.pdf
- ↑ TRCA. 2018. Inspection and Maintenance of Stormwater Best Management Practices: Rainwater Cisterns. https://sustainabletechnologies.ca/app/uploads/2018/02/Rainwater-Cisterns-Fact-Sheet.pdf


