Difference between revisions of "Dry ponds"
Jenny Hill (talk | contribs) m (→Sizing) |
Jenny Hill (talk | contribs) m (→Sizing) |
||
| Line 9: | Line 9: | ||
The surface storage volume of a dry pond (''A<sub>p</sub>'') is determined: | The surface storage volume of a dry pond (''A<sub>p</sub>'') is determined: | ||
| − | <math>A_{p}=\frac{RVC_T\times A_{c}}{f'\times | + | <math>A_{p}=\frac{RVC_T\times A_{c}}{f'\times t}}</math> |
{{Plainlist|1=Where: | {{Plainlist|1=Where: | ||
| Line 15: | Line 15: | ||
*''A<sub>c</sub>'' = Area of the catchment (m<sup>2</sup>) | *''A<sub>c</sub>'' = Area of the catchment (m<sup>2</sup>) | ||
*''f''' = design infiltration rate (mm/hr) | *''f''' = design infiltration rate (mm/hr) | ||
| − | *''t'' = [[ | + | *''t'' = [[drainage time|time permitted for ponding to infiltrate]] (hrs)}} |
---- | ---- | ||
Revision as of 21:39, 6 March 2018
Also known as infiltration basins.
Overview[edit]
Dry ponds are recommended as flood control structures to accommodate occasional excess overflow downstream of other structural BMPs. They should be integrated into the landscape as useful, accessible public space.
Design[edit]
Sizing[edit]
The surface storage volume of a dry pond (Ap) is determined:
Failed to parse (syntax error): {\displaystyle A_{p}=\frac{RVC_T\times A_{c}}{f'\times t}}}
Where:
- RVCT = Runoff volume control target (mm)
- Ac = Area of the catchment (m2)
- f' = design infiltration rate (mm/hr)
- t = time permitted for ponding to infiltrate (hrs)
Modeling[edit]


![]()
| Stage Storage | |
|---|---|
| Name | Important to have a unique name, to connect it with the catchment area |
| Storage type | Dry detention ponds |
| Bottom elevation (m) | This is important to correspond with other components, e.g. when the overflow is coupled to another BMP within a treatment train |
| Maximum depth (m) | |
| Lined/unlined | Unlined (ideally) |
| Underlying soil | Choose from five; sandy soils drain more quickly. |
| Evaporation factor | ? |
| Suction head (mm) | ? |
| Saturated conductivity (mm/hr) | ? |
| Initial soil moisture deficit (fraction) | ? |
| Curves | |
| The Curves table is designed to accommodate the side slopes. The top line begins at 0 m, with subsequent depths in the following lines. | |
Gallery[edit]
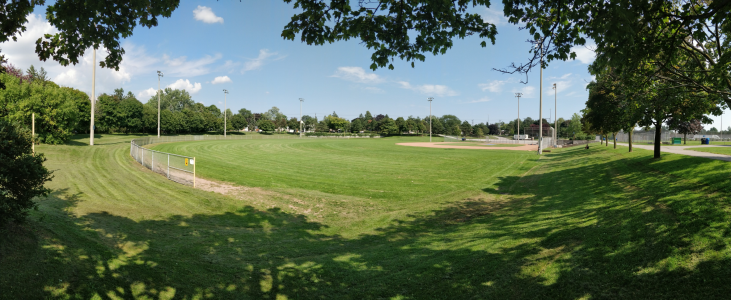
Wishing well park is a baseball field with flood warning signs, Scarborough ON
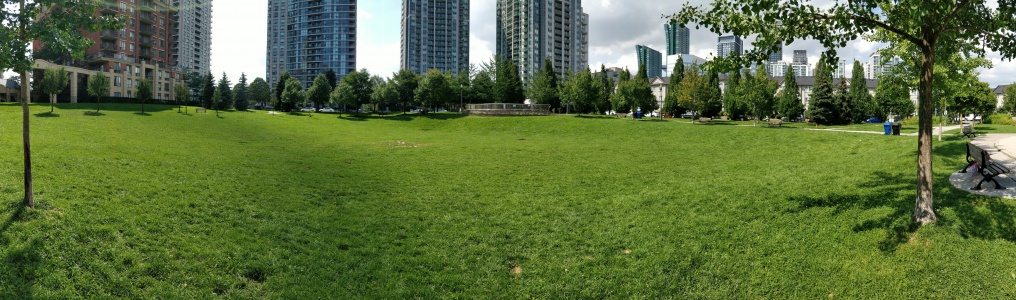
Avondale Park, designed for flood storage, but not optimized for infiltration, North York ON
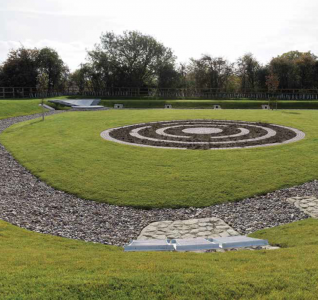
A multi-functional dry basin, still due to be fitted with playground equipment. Cambridge, UK. Photo credit: Simon Bunn

Stormwater lagoon, Wilmhurst Road, Warwick. UK. Photo credit: Robin Stott

Dry polder northwest of Vincencov, Prostějov. Czech Republic. Photo credit: Jiří Komárek


