Difference between revisions of "Drainage time"
Jenny Hill (talk | contribs) m |
Jenny Hill (talk | contribs) m |
||
| Line 1: | Line 1: | ||
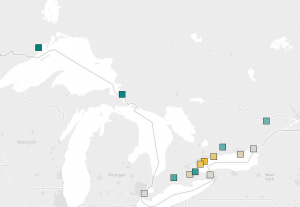
| − | [[File:Interevent times.PNG|thumb|link=https://public.tableau.com/views/StormIntereventTimesOntario/ | + | [[File:Interevent times.PNG|thumb|link=https://public.tableau.com/views/StormIntereventTimesOntario/Dashboard1?:embed=y&:display_count=yes&publish=yes|Darker teal locations have more frequent rainfall; darker yellow have the least frequent rainfall. This image links to a Tableau dashboard, where the interactive data may be viewed in more detail.]] |
The recommended drawdown times for all storage and infiltration facilities are based upon rainfall statistics and likelihood that the facility will have had time to regenerate storage capacity before the arrival of the next storm event. | The recommended drawdown times for all storage and infiltration facilities are based upon rainfall statistics and likelihood that the facility will have had time to regenerate storage capacity before the arrival of the next storm event. | ||
Revision as of 17:53, 18 October 2017
The recommended drawdown times for all storage and infiltration facilities are based upon rainfall statistics and likelihood that the facility will have had time to regenerate storage capacity before the arrival of the next storm event. A summary analysis of 14 locations across Ontario found that storms were most frequent in Thunder Bay and least frequent in Toronto; there is a ~50% chance of rainfall occurring again within 48 hours (Thunder Bay) to 72 hours (Toronto).
The analysis was conducted using the recommended minimum inter-event time of 12 hours from the MOECC[1], and earlier rainfall probability distribution parameters from 1960's-1980's [2]. It is not anticipated that recent incremental changes to our climate will have significantly impacted this broad window of recommended drawdown times. Locations considered included:
- Brantford
- Etobicoke
- Hamilton
- Kingston
- London
- Niagara Falls
- Oshawa
- Ottawa
- Peterborough
- Sault Ste Marie
- Thunder Bay
- Toronto
- Trenton
- Windsor
- ↑ Aquafor Beech, EarthFX. Runoff Volume Control Targets for Ontario Final Report. 2016:125. http://www.downloads.ene.gov.on.ca/envision/env_reg/er/documents/2017/012-9080_Runoff.pdf. Accessed September 11, 2017.
- ↑ Adams, B. J., and Papa, F. (2000). Urban stormwater management planning with analytical probabilistic models. Wiley.